
Included in All Access: one membership gives you this tool plus the full HTech NinjaTrader 8 suite.
Analyze Risk Reward at a Glance, Right on the Chart
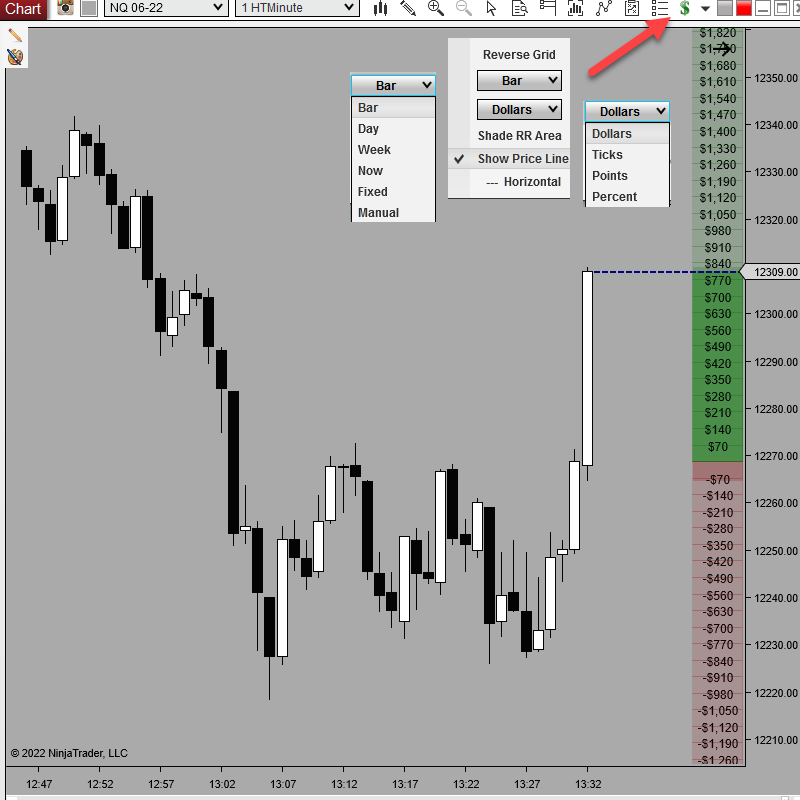
Chart Risk Reward pins a live risk/reward grid to the right edge of your NinjaTrader 8 chart. Risk and reward stay in view beside price, with no drawing tool to place and no measurement to redo as the market moves. One dollar-sign icon on your chart toolbar opens the whole menu.
Read the same grid in points, dollars, ticks, or percent, and anchor it however the trade calls for it: held to a bar, day, week, or fixed level, or set to Dynamic so it resets on every price change. See your risk and reward at a glance instead of drawing, measuring, and recalculating by hand.
Live right-side grid
Risk and reward stay visible right beside price, in whatever unit you choose to trade.
One toolbar icon
The dollar-sign menu changes grid type, style, units, and markers without opening settings.
Made for moving markets
Dynamic resets on price change; a right-click flips the grid; CrossHair drops it exactly.
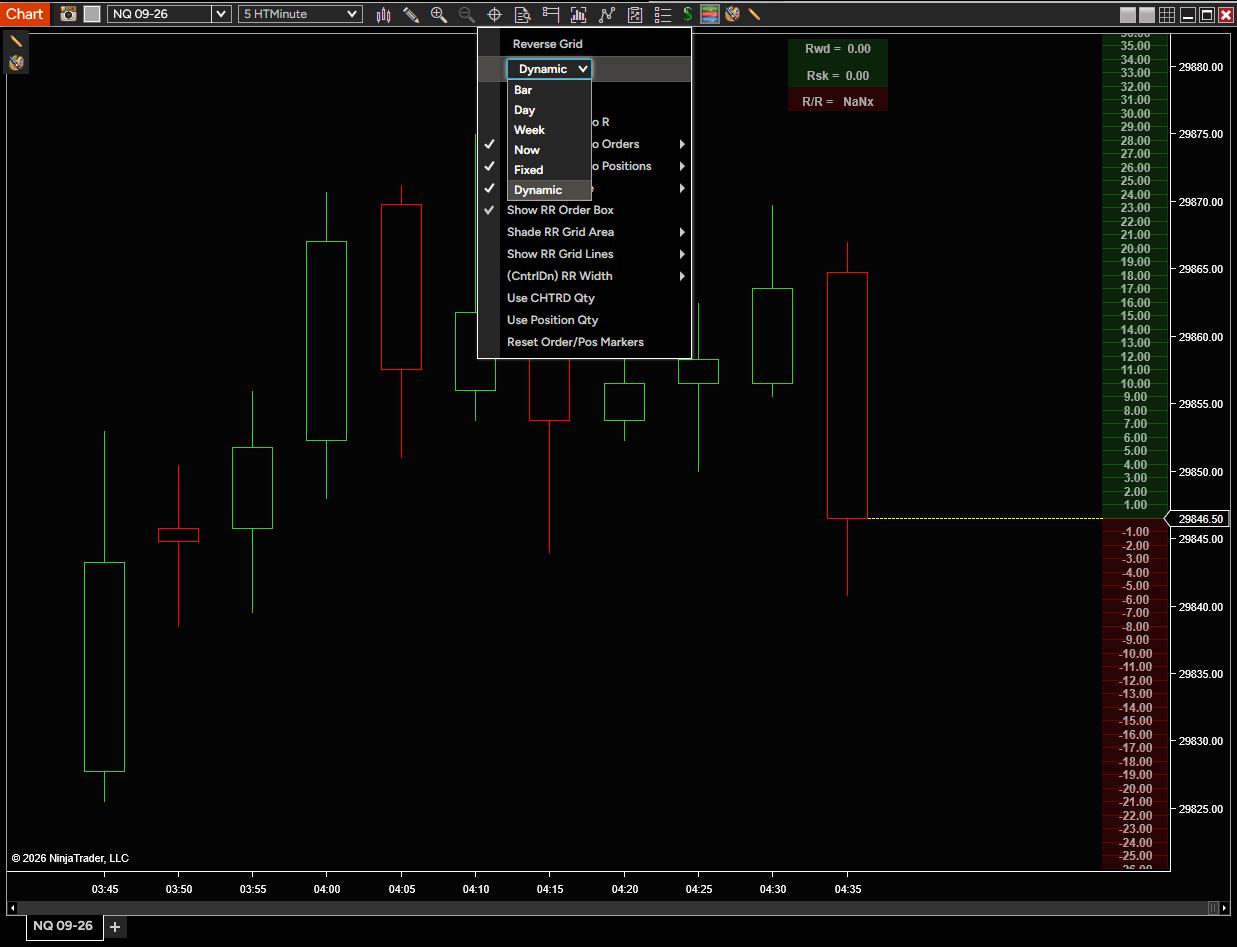
The dollar-sign toolbar icon opens the quick settings menu. Here the Type is set to Dynamic and the grid reads in points; the same menu changes the grid type, display unit, shaded risk/reward area, RR lines, and marker visibility.
Multiple types and styles, one dollar-sign menu
Chart Risk Reward gives you two independent controls: the Type sets what the grid is anchored to, and the display unit sets how the distance reads. Change either one instantly from the toolbar menu.
Grid Type
Anchor the grid to whatever the trade is built around.
Dynamic
Resets each price change to track live price.
Bar
Holds at the bar’s close and its travel.
Day
Shows how far price moved on the day.
Week
Shows the wider move across the week.
Now
Anchors to the current chart moment.
Fixed
Holds at a fixed level you set.
Two menu overrides re-anchor any Type to your working orders or your active position.
Display unit
Read the same grid in whichever measure the decision needs.
Points
Raw price distance above and below the reference.
Dollars
Converts the distance into trade-size value from the active quantity.
Ticks
Distance counted in instrument ticks.
Percent
Percentage move above and below the reference.
Show it as a shaded zone or clean lines
Shaded RR area
Set your 1R risk in dollars in the indicator’s Risk Reward settings, and the grid shades the risk and reward zones straight onto the chart, with RR1, RR2, and RR3 levels you can line or shade independently.
Adjustable width
Left-click the shaded area to set the width you want, or leave it at zero so the shading matches the line back to the first bar on the chart.
Built to keep up with a live chart
Snaps to your orders
Place an order and the grid instantly resets to it, whatever type or style you’re using, so you see the risk and reward around that order right away.
Flip it with a right-click
Right-click the dollar-sign toolbar icon to reverse the grid direction; middle-click it to hide the whole display for a clean chart, and middle-click again to bring it back.
CrossHair placement
Hold the Control key for CrossHair positioning and drop the grid exactly where you want it on the chart while you are in Dynamic mode.
Bring live order and position context onto the grid
When you want it, Chart Risk Reward tracks the trade itself. Turn on order and position markers and each stop and target is numbered to its order, with a Top-Right box showing reward, risk, and the R:R ratio for the marked trade. Size the grid in dollars from a manual quantity, from Chart Trader quantity, or from your active position, so the dollar risk on screen matches the size you are actually trading.
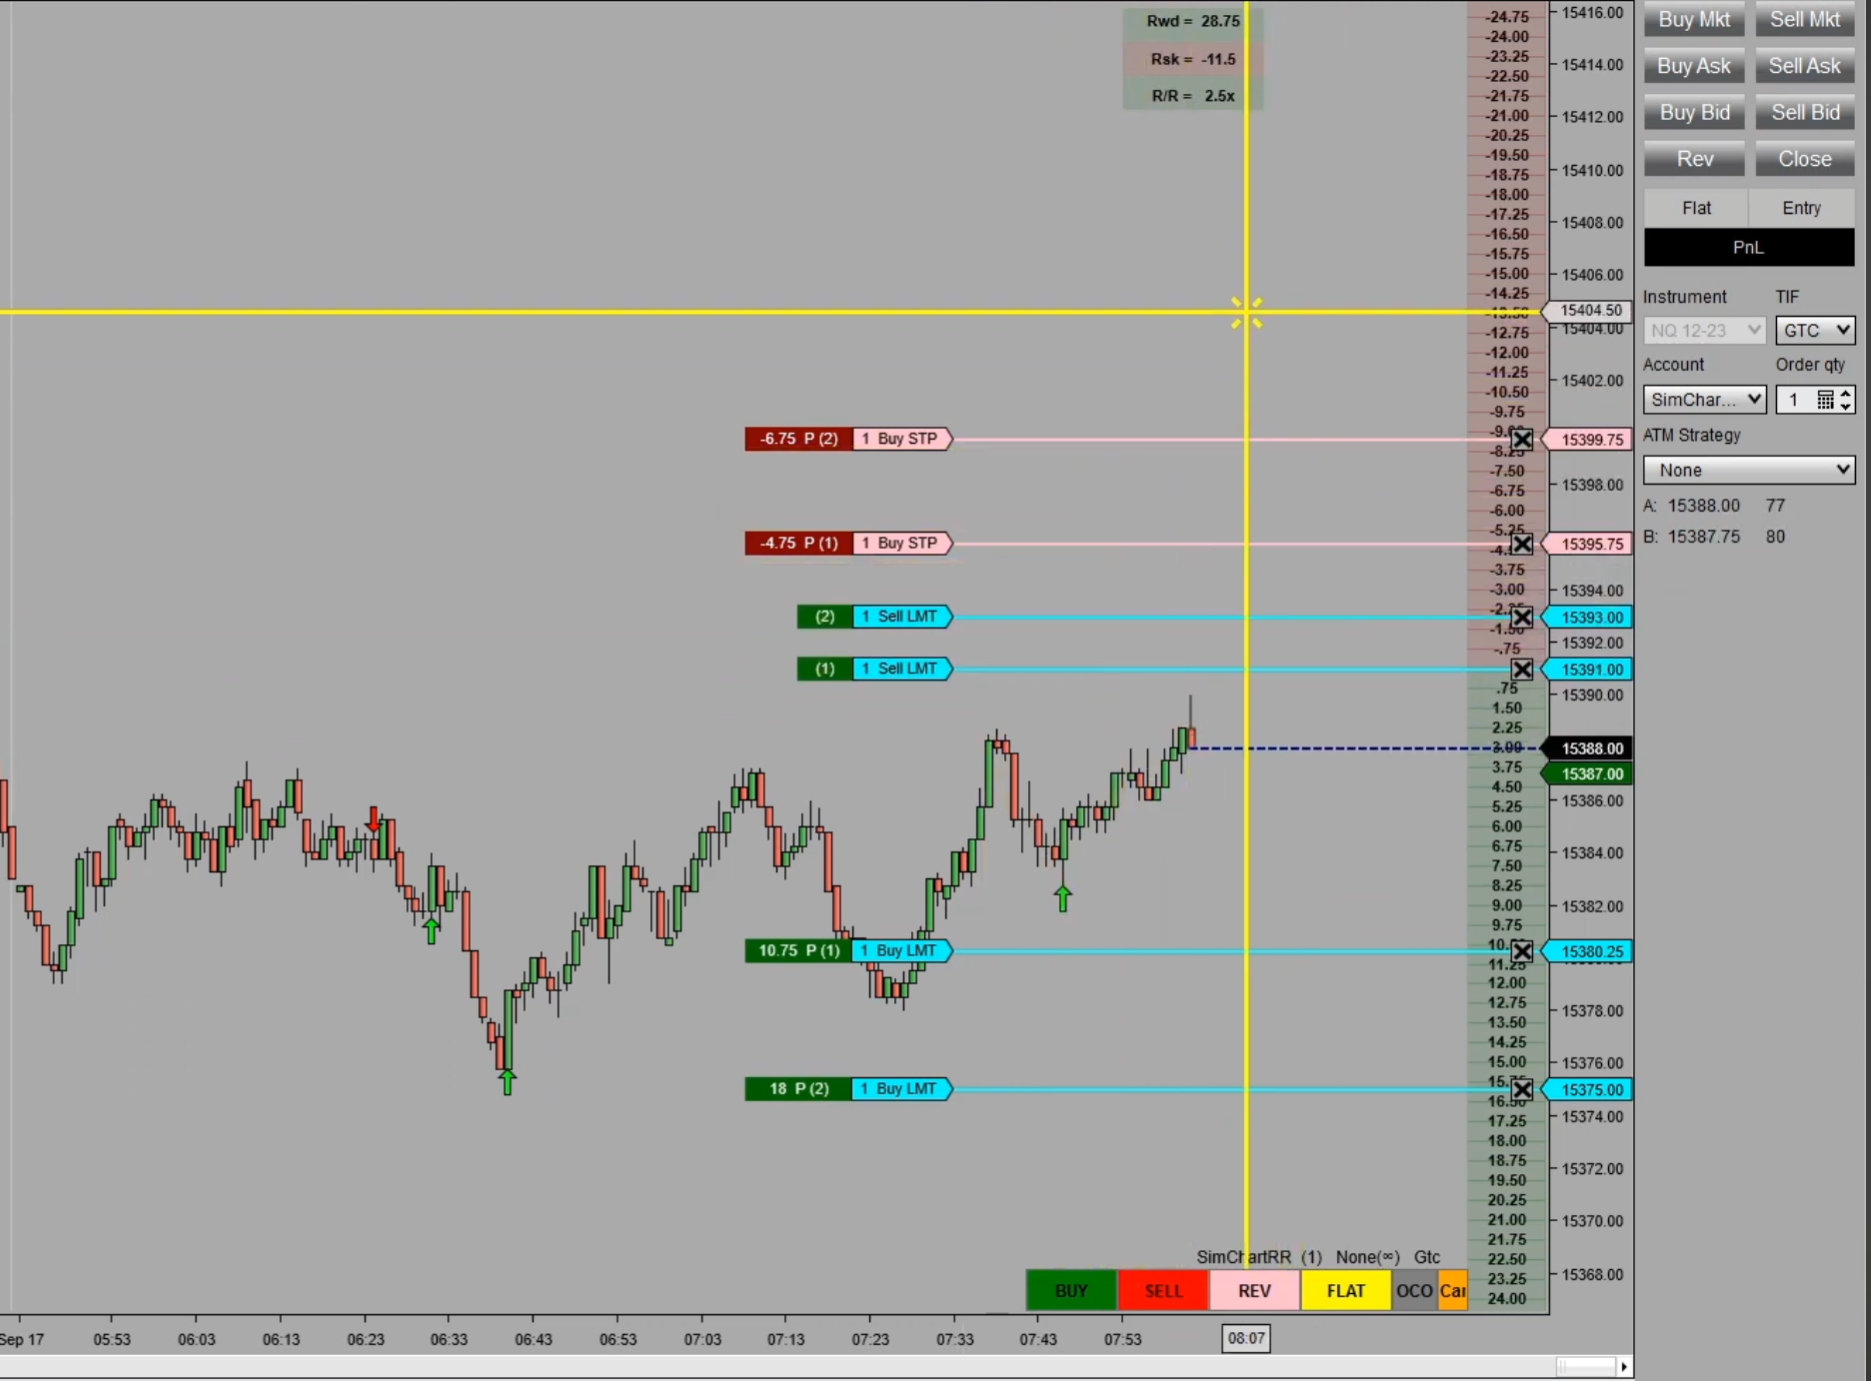
Each working stop and target carries a numbered marker with its distance, the Top-Right box reads reward, risk, and the R:R ratio (2.5x here), and Chart Trader sits alongside for quantity-based grid sizing.
Order markers
Numbered entry, target, and stop markers on open orders, with independent show/hide for the markers and their grid, plus a drop-down to reset order markers.
Position markers
Independent show/hide for active-position markers and their grid once you are in a trade.
R:R Top-Right box
A top-right readout of reward, risk, and ratio for the marked trade, with adjustable left/top offset.
Quantity source
Manual quantity, Chart Trader quantity, or active position quantity drives the dollar-based grid sizing.
Auto grid reset
The grid can automatically reset to an open order’s price so risk/reward re-centers on the trade.
ATM levels
Show or shade your ATM strategy’s levels on the grid, straight from the dollar-sign menu.
Price line
An optional price line at the grid reference, or full-width horizontal, in your color, style, and width.
Key features
- Always-visible risk/reward grid docked to the right side of the NinjaTrader 8 chart.
- Works on futures, stocks, forex, and crypto instruments.
- Reads distance in points, dollars, ticks, or percent, changed from the dollar-sign toolbar menu.
- Grid types: Bar, Day, Week, Now, Fixed, and Dynamic (resets on every price change), plus order and position overrides.
- Shaded risk/reward zones from the dollar amounts you set, or clean RR lines, with adjustable area width and grid width/offset.
- Right-click the toolbar icon to reverse the grid; hold Control for CrossHair placement in Dynamic mode.
- One-click R-multiple override labels the grid in 1R/2R/3R multiples of a risk price you enter.
- Numbered Chart Trader order markers for entry, target, and stop, with a Top-Right reward/risk/ratio box.
- Grid auto-resets to an open order’s price; markers reliably stack for stacked orders.
- Sizes the grid manually, from Chart Trader quantity, or from active position quantity.
- Independent show/hide for order markers, position markers, and their grids.
Why traders use it
Without Chart Risk Reward
- Draw and redraw a measurement tool every time price moves to keep risk and reward in view.
- Recalculate the distance by hand whenever you want it in dollars, ticks, or percent.
- Track your stops and targets separately from the risk/reward read you are working from.
With Chart Risk Reward
- Keep a live risk/reward grid docked to the right of price, with no redrawing as the market moves.
- Read the same grid in points, dollars, ticks, or percent, changed from one dollar-sign toolbar icon.
- Turn on numbered order and position markers so stops, targets, and the R:R ratio sit on the same grid.
Common uses
- Keeping risk/reward distance in view as price moves, without redrawing a measurement tool.
- Weighing a trade’s risk and reward before entry, then monitoring it live once orders are working.
- Sizing the on-chart dollar risk to Chart Trader or active-position quantity.
- Scalping and active day trading, where the read has to update on every tick.
What does Chart Risk Reward do?
It docks a live risk/reward grid to the right side of a NinjaTrader 8 chart, so you can read distance above and below your chosen reference in points, dollars, ticks, or percent without constantly redrawing a measurement tool.
What is the difference between a Type and a display unit?
The Type sets what the grid is anchored to: Bar, Day, Week, Now, Fixed, or Dynamic, and two menu overrides can re-anchor it to your working orders or your active position. The display unit sets how the distance reads: points, dollars, ticks, or percent. You change either one from the dollar-sign toolbar menu.
What does Dynamic mode do?
Dynamic resets the grid on every price change, so it keeps reading risk and reward around live price as the market moves. Hold Control for CrossHair positioning to place it precisely.
How does the R-multiple option work?
It is a one-click override on the menu. Set your 1R risk in dollars, and the grid relabels each level in multiples of that risk (1R, 2R, 3R, and so on) instead of the current unit.
Can it use Chart Trader or position quantity?
Yes. The dollar grid can be sized from your Chart Trader quantity or from your active position quantity, so the risk shown reflects the size you are actually trading.
What markets does it support?
It works on futures, stocks, forex, and crypto instruments.
Requirements: Windows and NinjaTrader 8.1.2.1 or later.


John van Niekerk (verified owner) –
Excellent tool to gage how wide the market is moving. Often its difficult to see the range on a single chart and this is a lifesaver.
Frank Cunningham (verified owner) –
The Risk and Reward Chart Indicator has proven to be an invaluable tool in my trading journey, offering several significant benefits:
1. Effortless Risk Management: This indicator excels in simplifying risk management during trades. It empowers me to calculate and monitor my risk with ease, providing a clear visualization of potential losses and gains.
2. Pre-Trade Analysis: One of the standout features is the ability to analyze risk and reward before entering a trade. This is a game-changer as it enables me to make more informed decisions upfront, reducing the likelihood of impulsive trades.
3. User-Friendly Design: The user interface is straightforward and easy to navigate. It avoids unnecessary complexity, making it accessible to traders of all levels. It’s a relief to find a tool that enhances efficiency without overburdening with unnecessary features.
Paul Sauls (verified owner) –
This indicator is an absolute MUST HAVE TOOL for me. The information this indicator gives you dynamically and the unobtrusive way it is displayed are a great help for any trader who truly wants to trade as a PROFESSIONAL rather than shooting from the hip. You can instantly see the amount you are risking and the potential gains and they are updated in real time. I’m currently checking out a new beta version of this indicator which adds some very useful and valuable improvements to the original version which was already quite indispensable. Namely, the ability to have the vertical profit/loss scale adjust dynamically to your actual position size is a welcome addition you will certainly find very helpful. Also, the addition of the option to display both order and position markers is a definite PLUS! I really like the ability to adjust several parameters right on the chart without having to call up the indicator window. This is a feature that is pretty standard in all of the High Tech indys and it saves the user a lot of time and hassle. Overall, this indicator is a stellar addition to my trading toolkit. I also have a couple of the HT volume profile indicators (Sessions and Composite) and I find that all the HT indys are very intuitive with useful and plentiful user-configurable settings. Bottom line…this Chart Risk Reward indy is excellent!
Ryan Porter (verified owner) –
The new dynamic feature and the ability to chose the parameters and visually see profit and stop loss regions has been a game changer to executing trades. I would recommend to any scalper out there to maximize awareness and visualize where opportunity presents itself.
Mailman (verified owner) –
This is an outstanding addition to NT8 for a scalper. It comes at displaying RR differently than the typical toolbar methods that other vendors use (e.g. click a drawing tool, set two or three points on the chart, view it, then erase it to be prepared for the next one). This HTC product is continually updating based on the reference anchoring I set for it. I see the RR immediately. It automatically flips its display when a short is initiated. Its anchor points are varied and can be fixed or floating. The elegant design is focused on the needs of the active day trader (scalper) and its implementation for day to day use is, as are all HTC products, second to none.