

Included in All Access: one membership gives you this tool plus the full HTech NinjaTrader 8 suite.
See what happened inside every bar, at every price level.
Most of what you need to read a bar is destroyed the moment it prints. The open, the high, the low and the close survive. The order flow that built them does not. A green candle tells you price closed higher. It does not tell you whether buyers paid up for every tick, or whether sellers were absorbing them at the high.
That record does exist. Every trade executes against a bid or an ask, and NinjaTrader 8 keeps that detail in its tick data. Volume Profile OrderFlow reads it back and rebuilds a complete buy and sell profile for every bar on your chart, at every price that bar traded.
It is the only tool in the HTech NinjaTrader 8 lineup that requires Tick Replay, and the deepest read we build.
Read the bid and the ask at every price
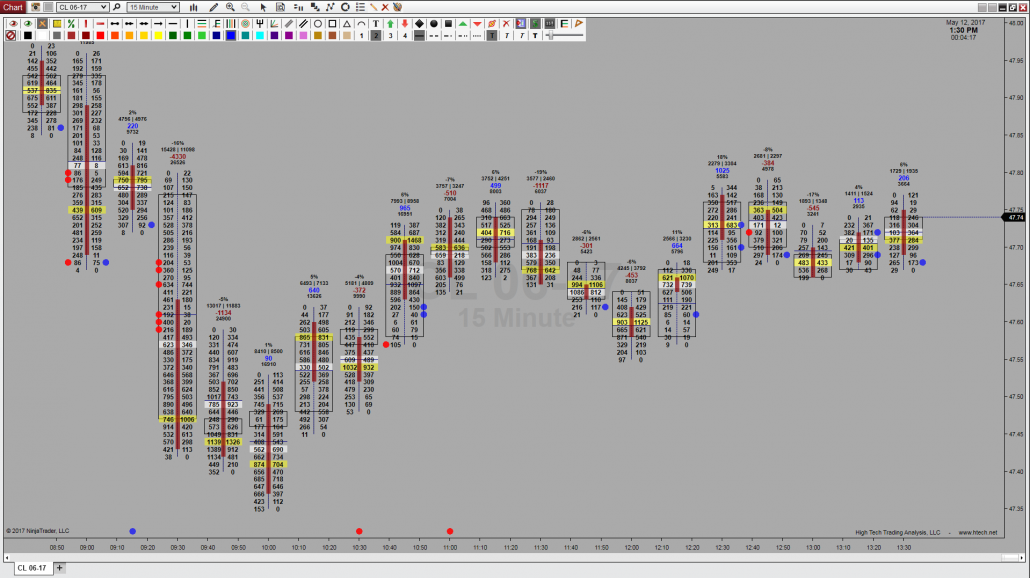
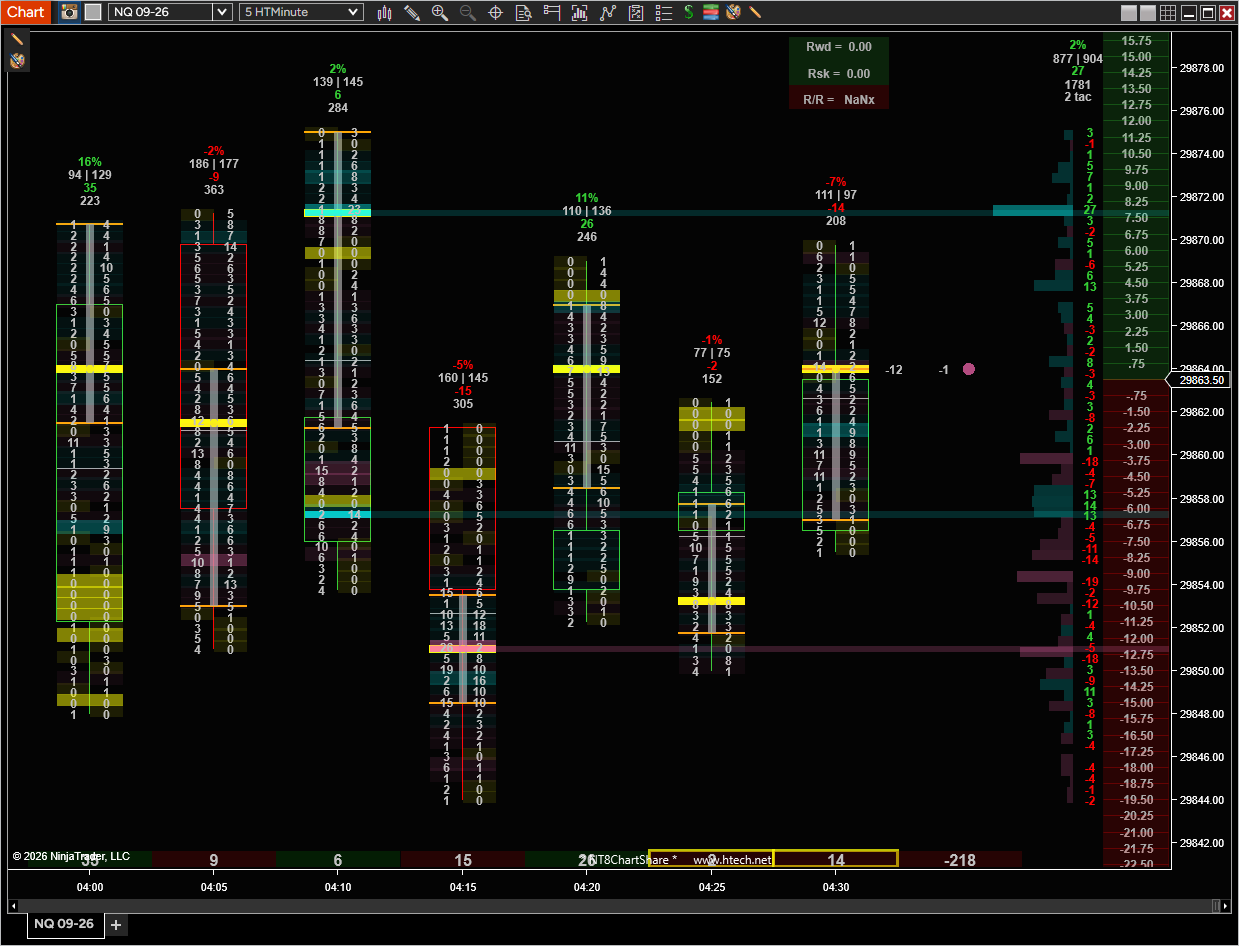
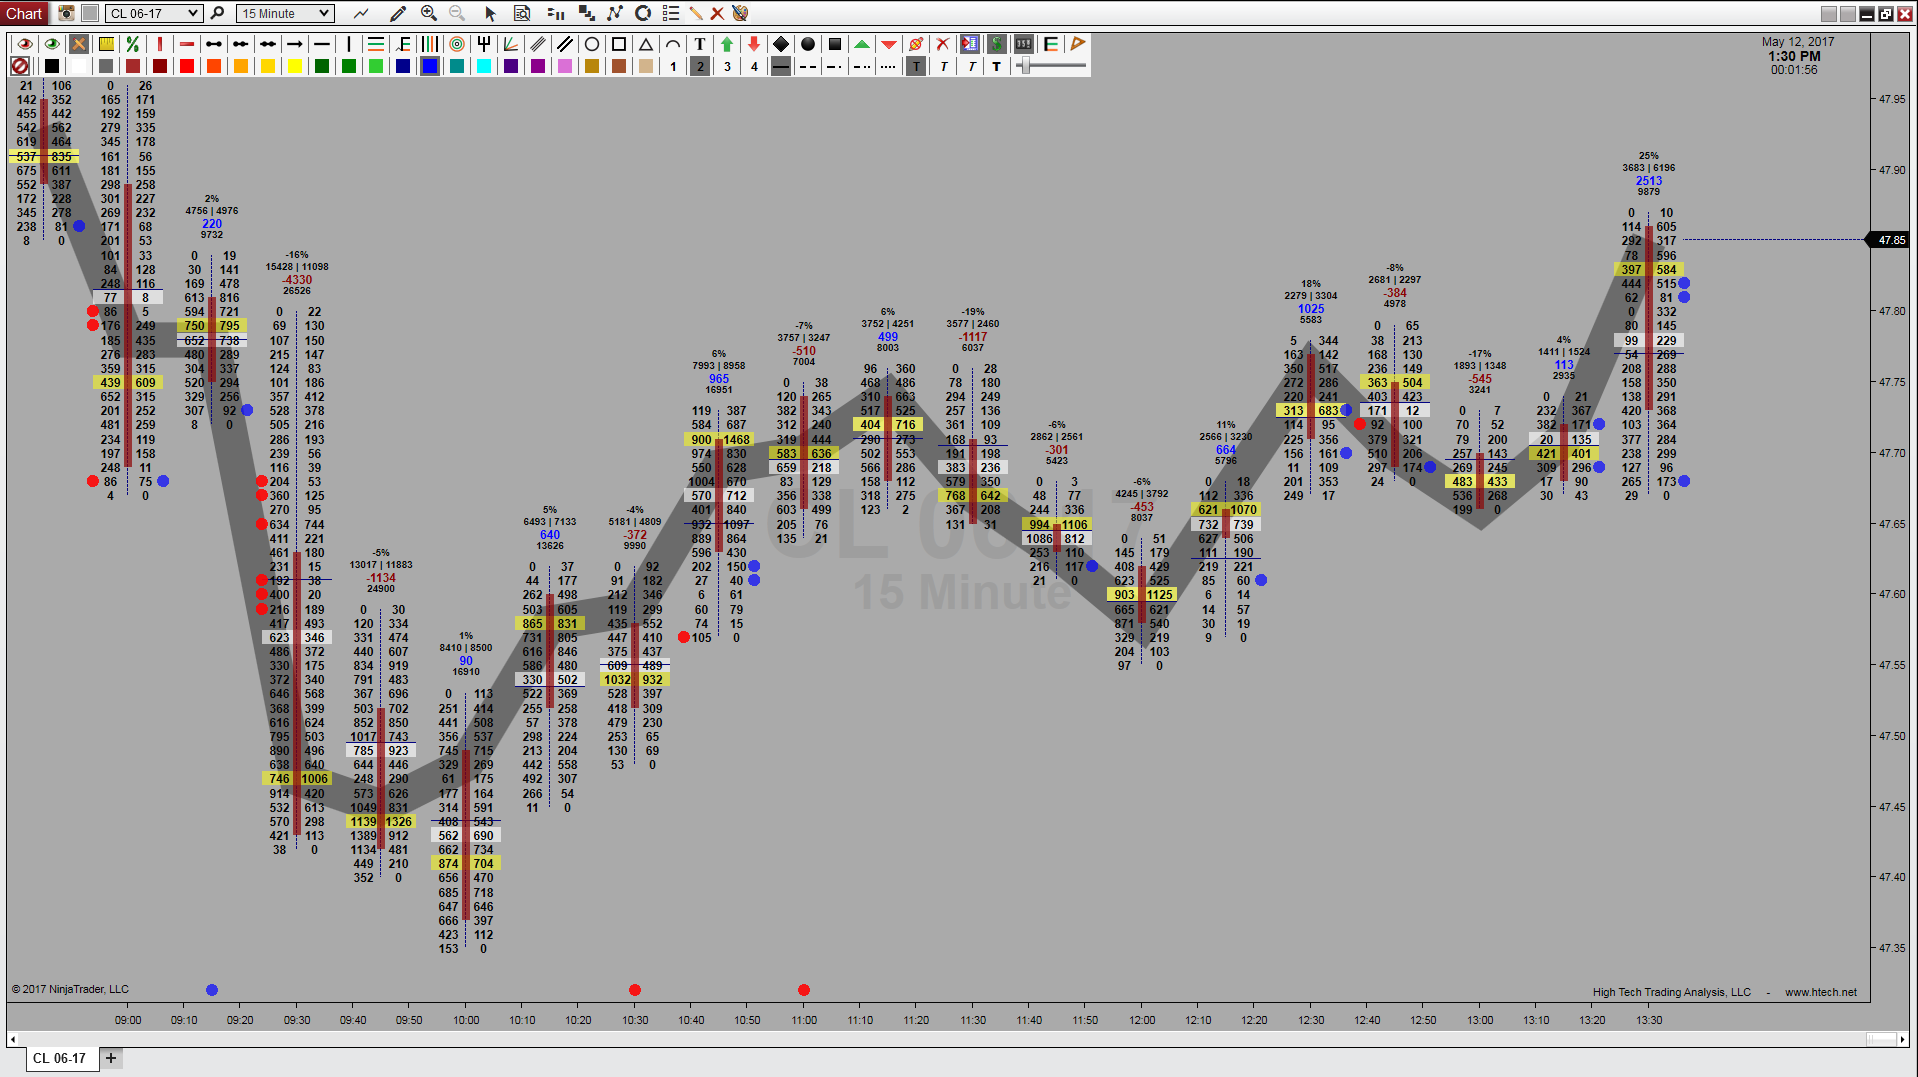
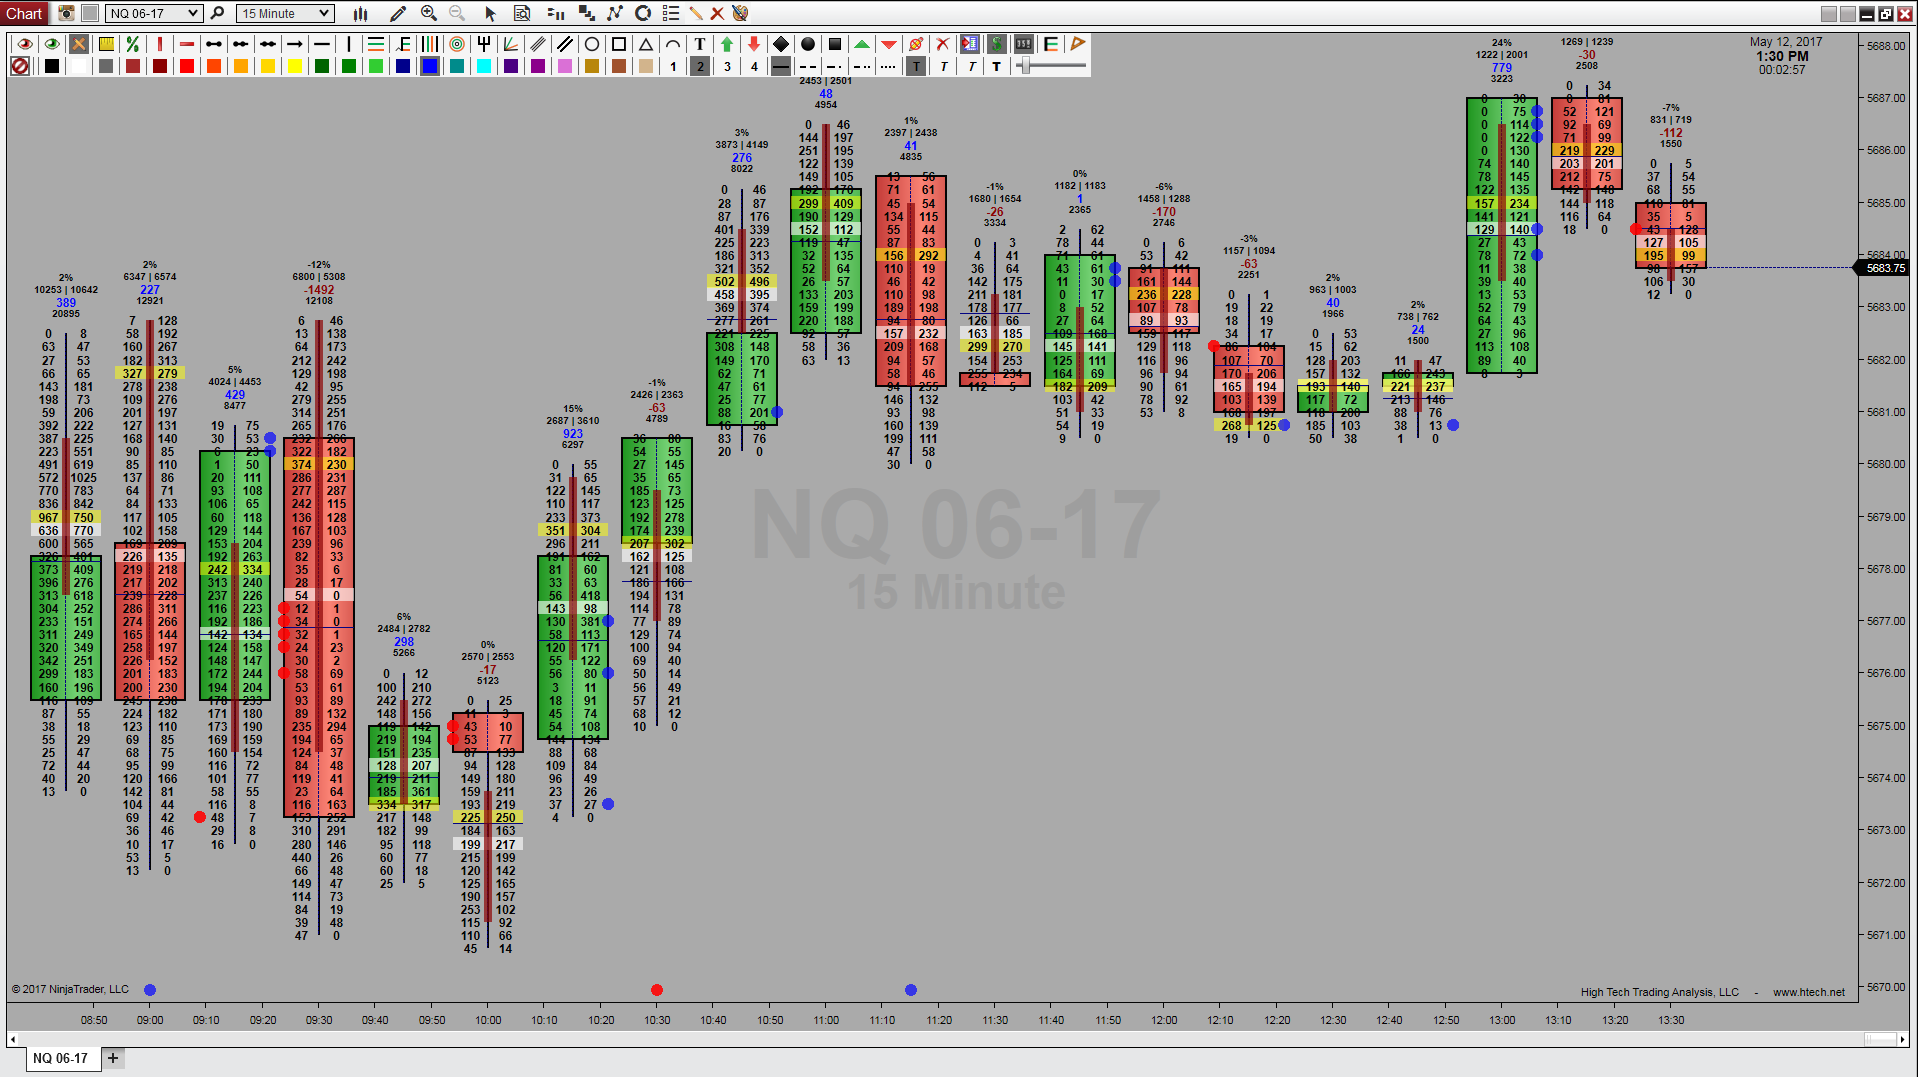
Each bar becomes a ladder: sell volume on one side, buy volume on the other, one row for every price the bar traded. Switch the whole ladder to delta at price when the difference between the two sides is the cleaner read. When you zoom out and the rows get too tight to be useful, Auto Combine merges them into groups instead of letting the bar collapse into noise.
Volume at price
Executed buy volume beside executed sell volume, one row per traded price.
Delta at price
One signed number per row when the net of the two sides is the cleaner read.
Auto Combine
Rows merge into readable groups as you zoom out, so the bar still tells you something.
Keep the levels that matter on every bar
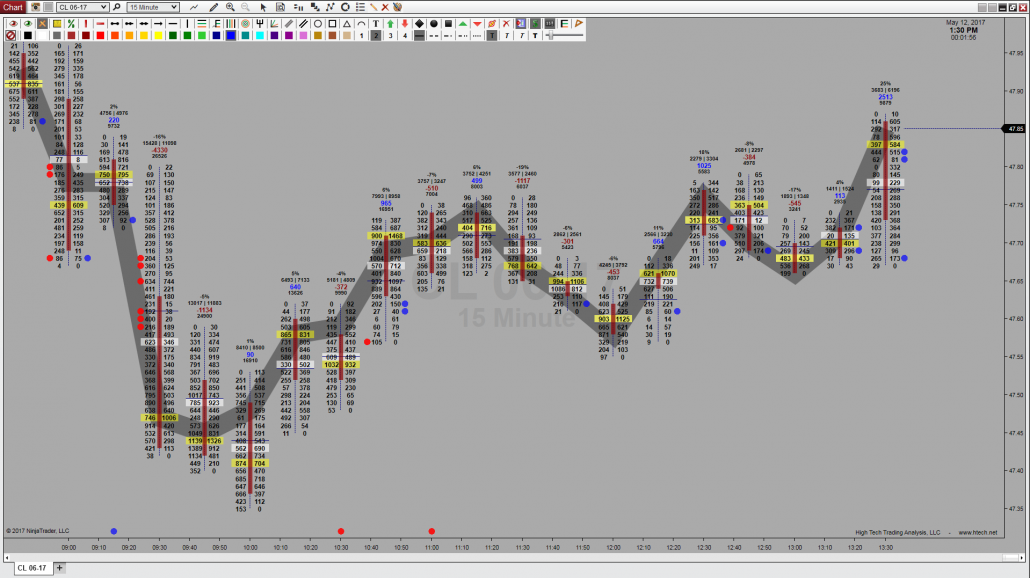
The profile is calculated per bar, so the levels are too. Point of Control marks the price with the most volume traded in that bar. The Value Area covers the percentage of the bar’s volume you choose. VWAP and the profile MidPoint give you two more reference points without a second study on the chart. Each level also carries a plot, so you can give POC, VWAP, the value-area edges, or the MidPoint a color and connect them across bars as a line.
POC
The price that traded the most volume inside the bar.
Value Area
The price range holding the percentage of bar volume you set.
VWAP
The volume weighted average price of that bar’s profile.
MidPoint
The midpoint of the profile’s price range, drawn per bar.
Find the prices where one side had to pay up
An imbalance is a price where one side was hit far harder than the other. You set a single Imbalance Multiplier, say five. A level is marked when one side’s volume is at least five times the other’s. That test is applied two ways, independently: horizontal compares buying against selling at the same price, and diagonal compares them across neighboring prices, the way a ladder is normally read. Use either one, use both, or require both at once with combined logic. A minimum-volume floor keeps a two-lot against a zero-lot from ever counting as a signal.
Marked levels can be shaded on the ladder, and they can be extended to the right for as many bars as you choose. That is what turns an imbalance from a note on a printed bar into a level sitting on your chart, waiting for price to come back and test it.
Watch a delta profile build down the right edge
The delta histogram sits to the right of price and draws one bar per level, sized by the net delta at that price. By default it profiles the developing bar. Raise the merge count and it folds the last several bars into one profile, so you can see where the flow has actually been concentrated across a move rather than inside a single candle. It can split around a center axis so buying draws one way and selling the other, scale against a high percentile so a single outlier row does not flatten everything else, and fade its own opacity so quiet flow draws faint and unusual flow draws saturated.
The bar whose delta disagrees with its direction
Along the bottom of the chart, every bar prints its delta, colored by which side won it. Above each bar sit up to four lines you can turn on independently: delta percentage, bid against ask, net delta, and total volume. At the top, a chart summary keeps the cumulative delta of every bar currently in view, and the total changes as you scroll.
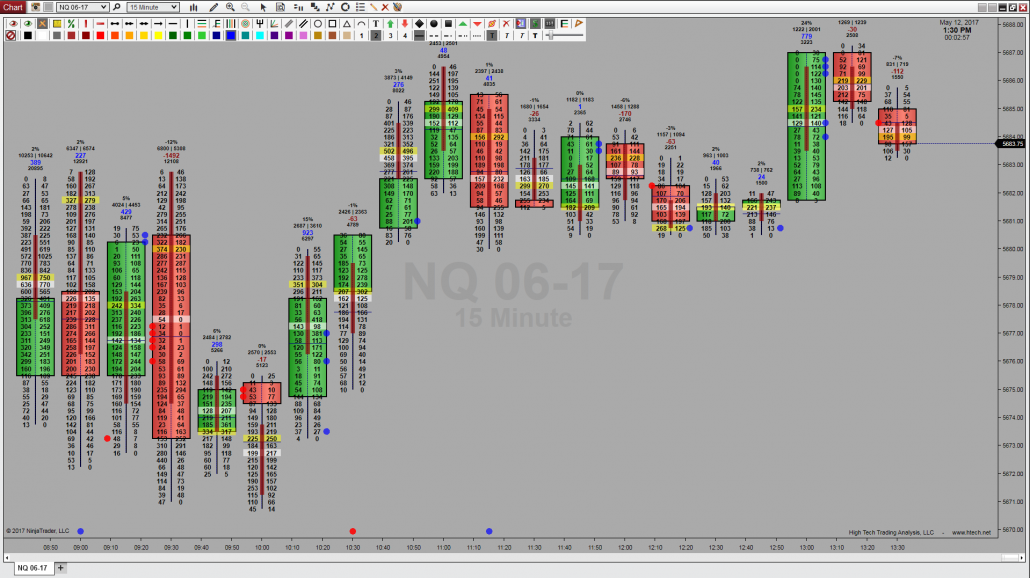
Then there is the one that earns the tool. When a bar’s delta contradicts the bar itself, an up bar built on net selling, or a down bar built on net buying, its cell in the bottom grid is boxed. Price went one way, the order went the other. Those are the bars to look at twice.
Built for detailed order-flow reading
- Rebuilds executed buy and sell volume at every price level inside every bar, from tick data.
- Shows volume at price or delta at price, with Auto Combine keeping the rows readable as you zoom.
- Calculates per-bar POC, Value Area, VWAP, and MidPoint, each with an optional connecting plot.
- Marks diagonal, horizontal, or combined imbalances on one multiplier, with a minimum-volume floor.
- Shades marked levels and extends them right as levels that persist on the chart.
- Profiles net delta per price in a right-edge histogram that can merge the last several bars.
- Prints a four-line bar summary, a running chart summary, and a bottom delta grid.
- Boxes any bar whose delta disagrees with its direction, so divergence is visible at a glance.
- Flags big lots at the prices where they traded, above the size threshold you set.
- Marks price and no-volume imbalances where a level barely traded, or did not trade at all.
- Toggles every surface from a toolbar dropdown, with no trip back through properties.
- Runs calculation-only inside a strategy when you need the numbers and not the chart.
Without Volume Profile OrderFlow
- Read the finished shape of a bar and guess which side actually drove it.
- Treat total volume as one number, with no idea which prices absorbed it.
- Miss the up bar that was built on net selling, and find out much later.
With Volume Profile OrderFlow
- See executed buys against sells at every price the bar traded.
- Watch the imbalanced levels stay on the chart as price returns to test them.
- Get the contradicting bar boxed for you the moment it closes.
Keep your full history and still run order flow
Tick Replay is heavy, so a chart with a hundred days of it loads slowly. You do not have to choose between order flow and the history your other indicators need.
- Load your normal chart with all the history you usually run.
- Add a second data series, same instrument and interval, with only three to five days loaded and Tick Replay enabled on it.
- Apply Volume Profile OrderFlow to that second series, then set the series itself to transparent.
Your weekly and previous-session values stay correct, because the primary series still carries the history. The order flow only ever loads the few days you actually read it on, and the chart opens in seconds.
Does Volume Profile OrderFlow require Tick Replay?
Yes. It is the only HTech tool that does. Tick Replay supplies the bid and ask of each trade, which is what lets the indicator classify volume as buying or selling. Without it there is nothing to build a profile from.
Can I set different ratios for diagonal and horizontal imbalance?
There is one Imbalance Multiplier. The diagonal comparison and the horizontal comparison are each evaluated independently against it, and combined logic requires both to be met at the same level. A separate minimum-volume setting keeps very small trades from qualifying.
Will it alert me when an imbalance appears?
The imbalance markers are visual. They are drawn on the chart in the buy and sell colors you configure, and can be shaded and extended to the right. There is no sound or popup alert.
Why does the detail stop drawing when I zoom out?
By design. Once more than about two hundred bars are on screen, or the bars get narrower than the text, per-price detail is unreadable anyway. Zoom back in and it returns. Auto Combine is the setting that keeps the ladder useful in between.
Can I use it inside a strategy?
Yes. It has a calculation-only mode that skips the toolbar button and all rendering, so a strategy can consume its values without drawing anything on the chart.
Do the HT chart styles come with it?
Yes. HT Candlestick and HT Gradient Bar are included with any HTech purchase. HT Candlestick lets you set the transparency of the bar body, which is worth knowing here, because it lets the ladder read cleanly through the bar.
Requirements: Windows and NinjaTrader 8.1.2.1 or later.


seszaF1 (verified owner) –
its 1 of many tools you must have if you are as serious trader and I do. I like it a lot makes my job a lot easier to find hidden support and resistant as imbalances, observations see who is in control .And its just getting better with a lot of new updates
Great job High Tech