
Included in All Access: one membership gives you this tool plus the full HTech NinjaTrader 8 suite.
35 levels on tap. Only the ones you want on the chart.
Price Times Plus plots the price references traders keep coming back to. The high and low of the day in progress, the overnight Globex range, yesterday’s high, low and close, last week, this month and last, the current contract and the one before it, rolling highs and lows over the last few days, and up to three times of day that you choose yourself. Thirty-five levels, all drawn by one NinjaTrader 8 indicator.
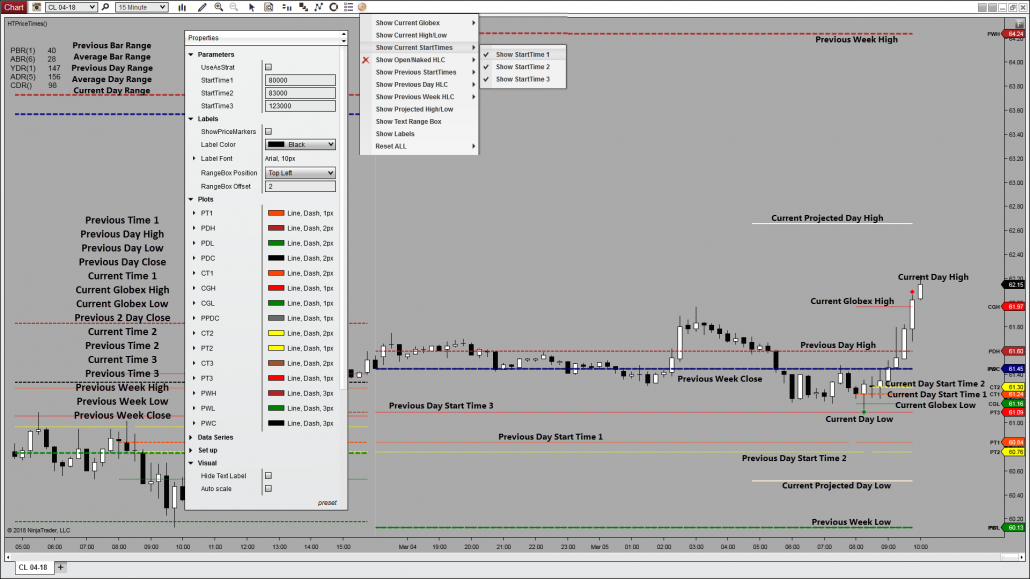
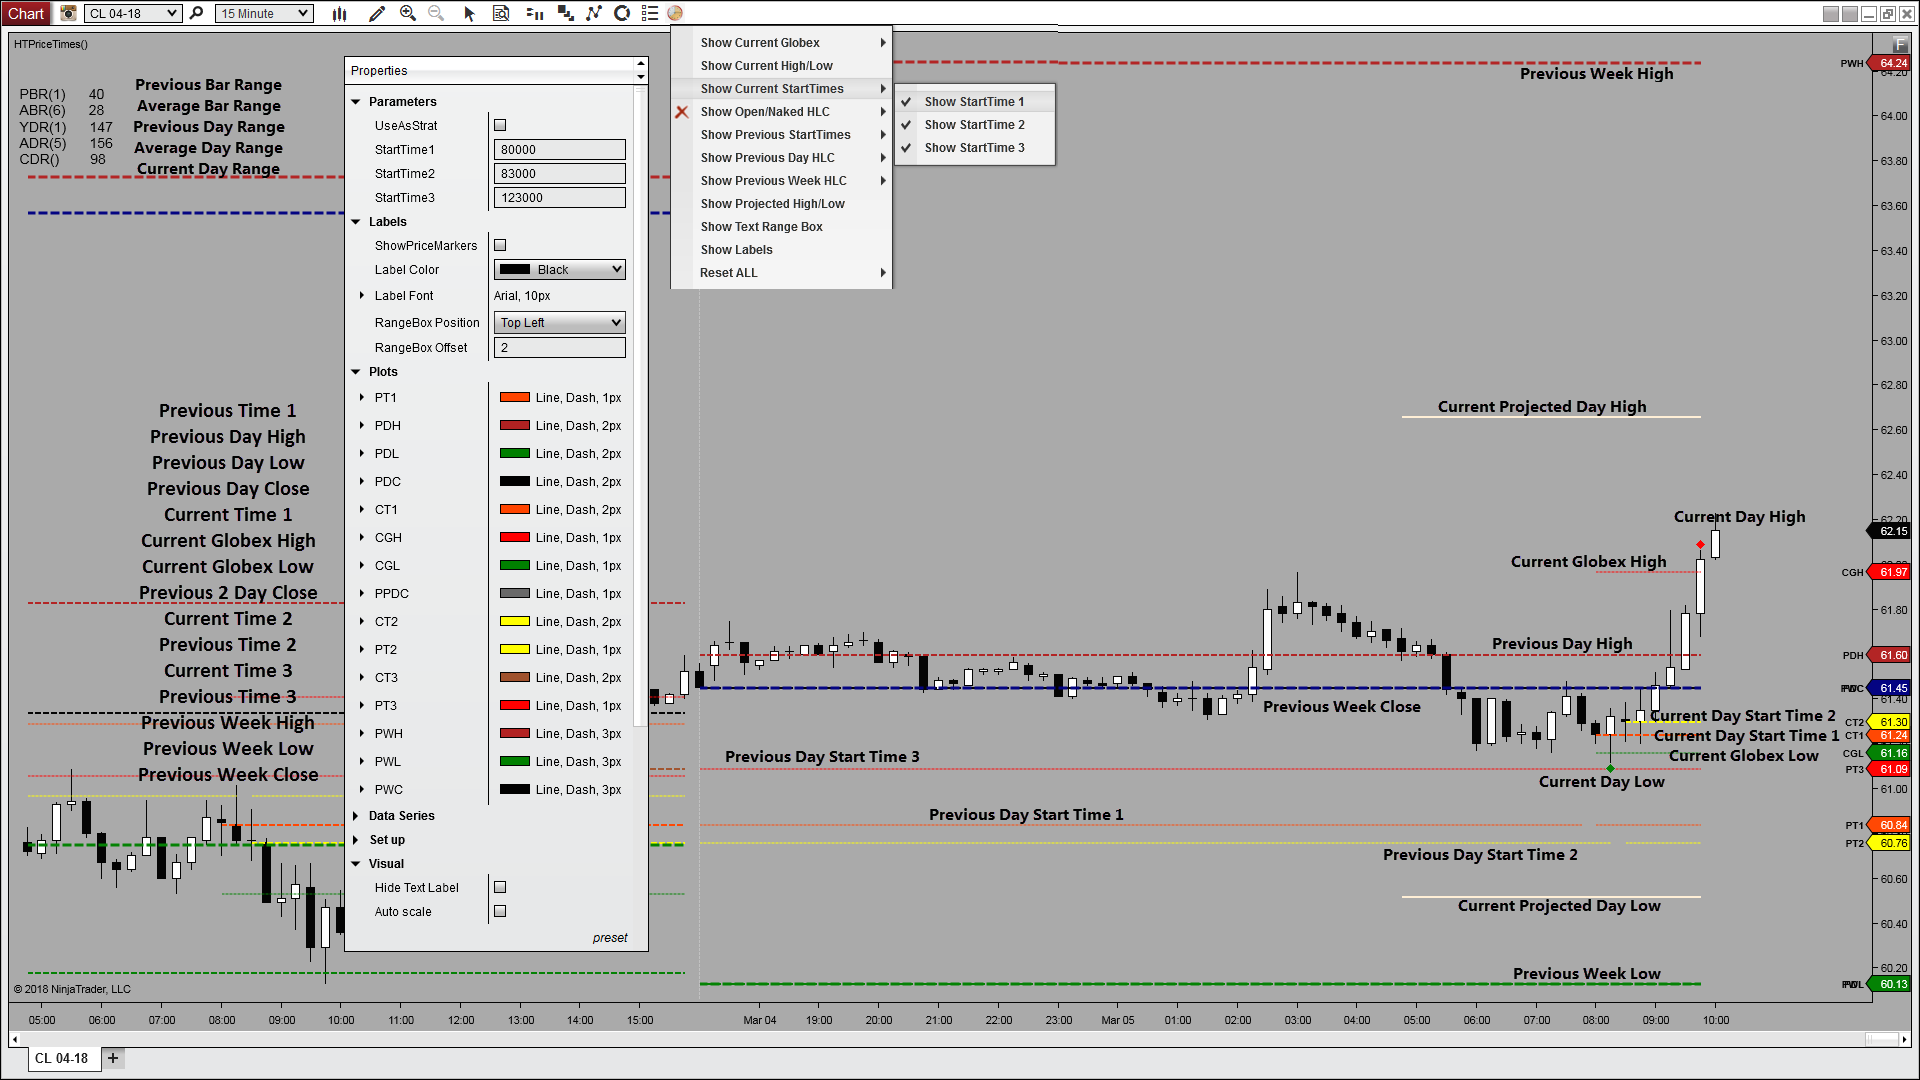
A number like that raises the obvious worry: a chart buried under lines. That is not how it works. Every single level has its own switch, and all of those switches sit behind one icon on the chart toolbar. Show one. Show all thirty-five. Show none at all. The chart follows you as you click, with no properties window to open and nothing to reload.
All 35 levels, group by group
These are the twelve groups exactly as the toolbar menu lists them, so what you read here is what you will click on the chart. Nothing in the set is a variation on the same idea. Each group answers a different question about where price has already been, and each one arrives with its own color, line style, and label so it stays distinguishable from its neighbors on a busy chart.
Current Day 2
Session high and low, with optional diamonds.
Previous Day 4
High, low, close, and the close before that.
Current Globex 2
High and low of the overnight Globex session.
Current Start Times 3
Today’s opening price at your three chosen times.
Previous Start Times 3
The same three times, taken from yesterday.
Current Week 2
High and low of the week now in progress.
Previous Week 3
Last week’s high, low, and close, carried over.
Current Month 2
High and low of the month now in progress.
Previous Month 3
Last month’s high, low, and closing price.
Current Contract 2
High and low of the contract trading now.
Previous Contract 3
High, low, and close of the prior contract.
Rolling Days Back 6
Highs and lows over three lookbacks you set.
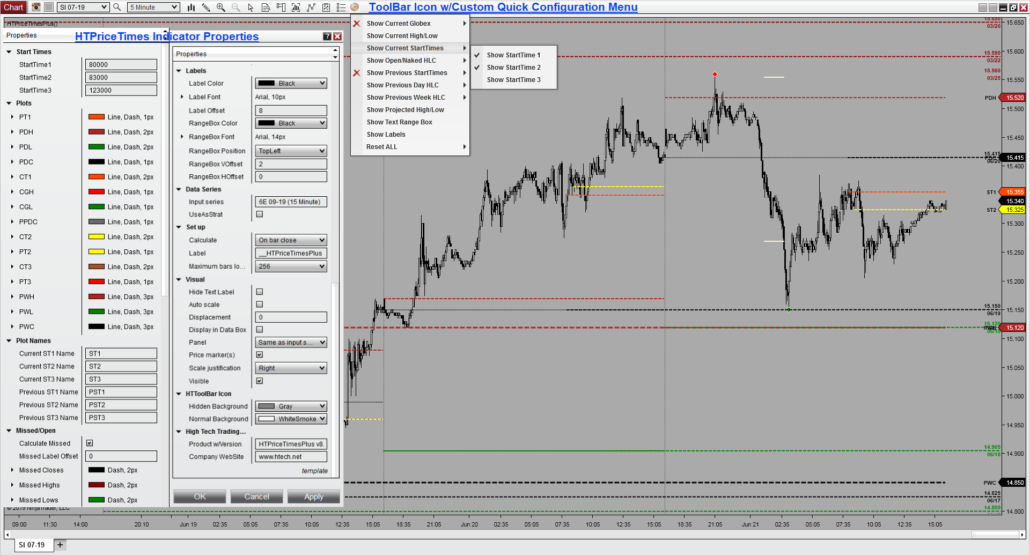
The toolbar icon: any level on or off, without stopping the chart
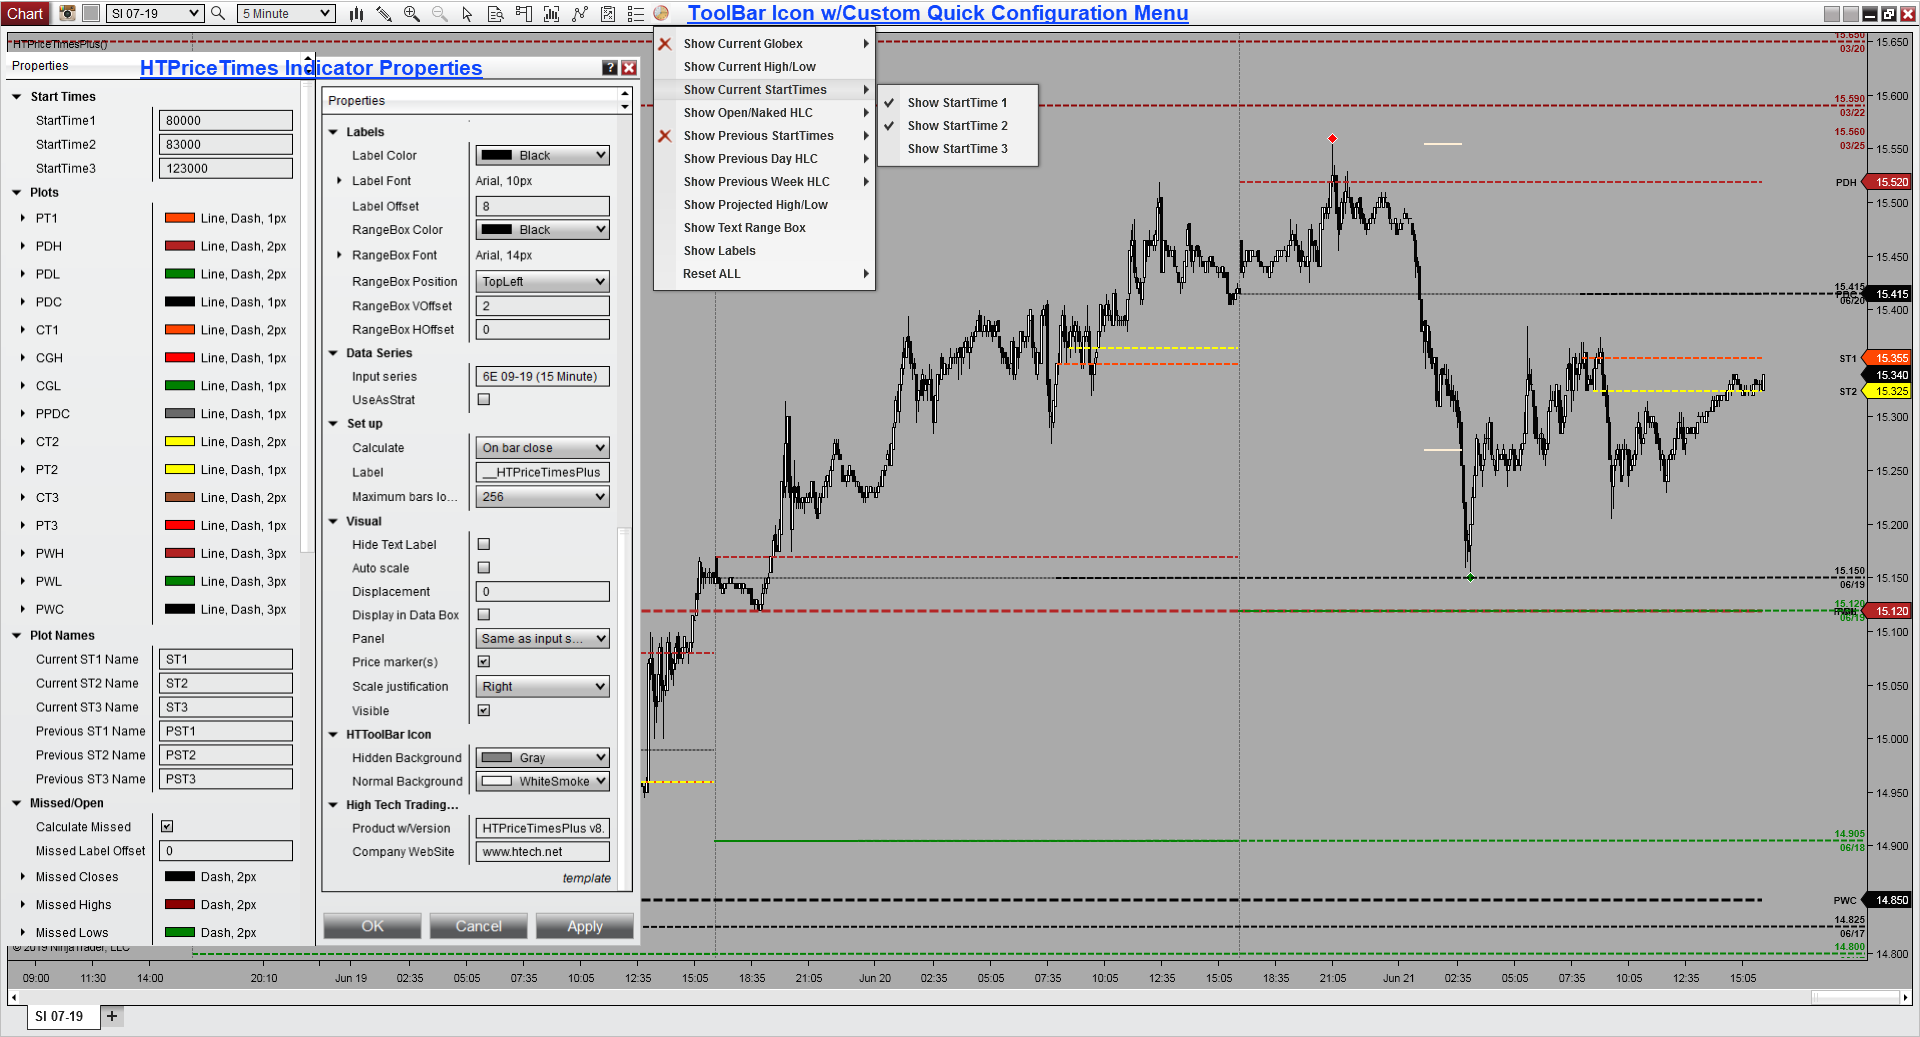
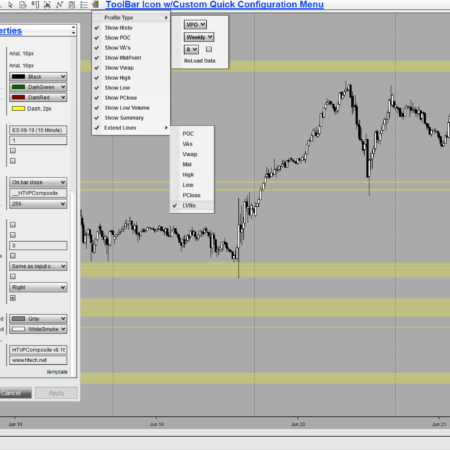
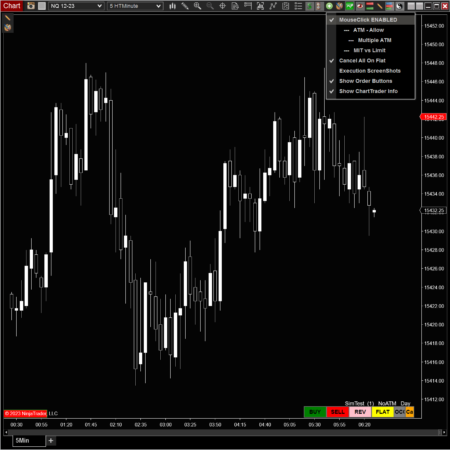
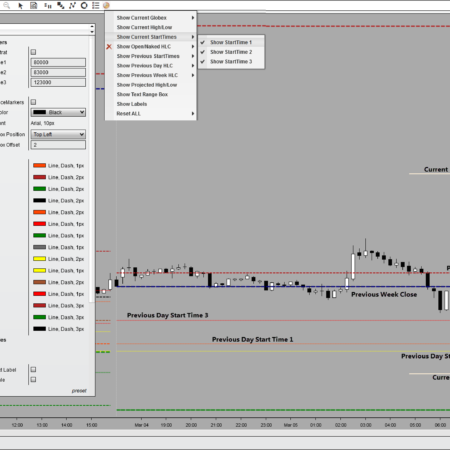
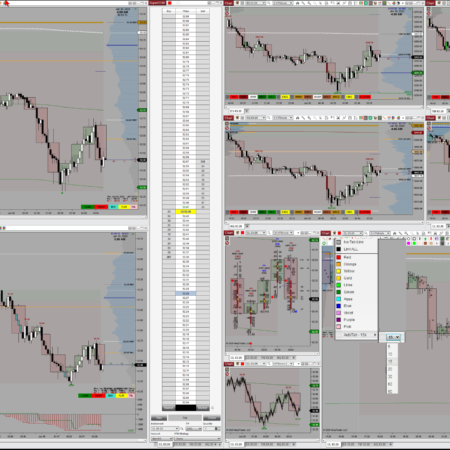
The switches for all 35 levels live on the chart toolbar, not buried inside the indicator’s properties window. Click the Price Times icon and the menu drops open right over the chart. Turn on last week’s close. Turn off the rolling highs. Hide the whole start-time group, then bring two of its three lines back a moment later. The chart redraws as you go, and you never leave it.
The groups behave the way you would want them to. A parent item such as Show Rolling Days HL is a visibility gate, not a reset. Switch it off to clear those six lines from the chart, switch it back on, and the individual choices you made inside it are exactly as you left them. Reset ALL is the one item that deliberately changes everything at once, and it is there for when you want a clean slate.
- Show a single level, a whole group, all 35, or nothing at all.
- Change what is drawn without ever opening indicator properties.
- No chart reload, and no reapplying the indicator afterwards.
- Color, line style, width, and label stay configurable per level.
The summary box: what every range is worth, in ticks and dollars
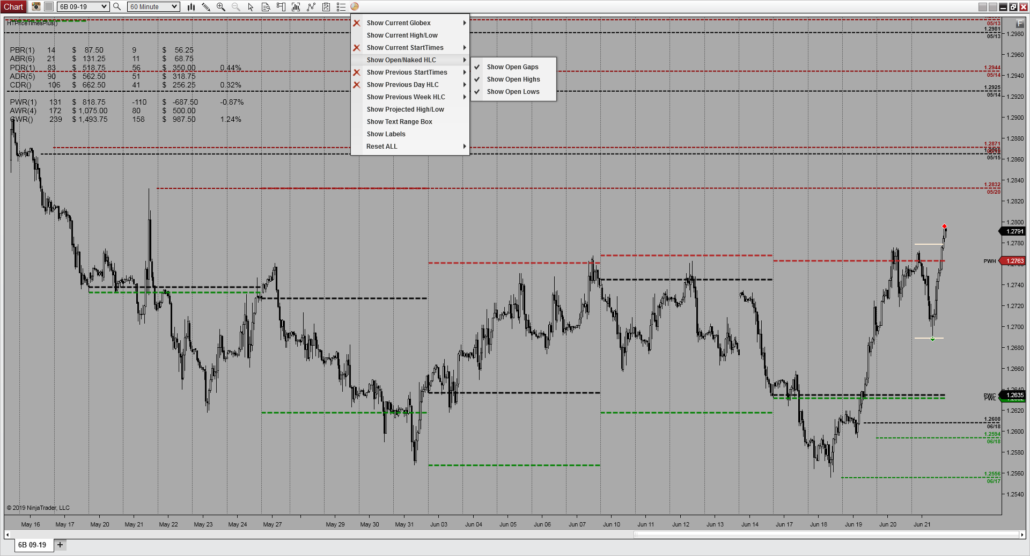
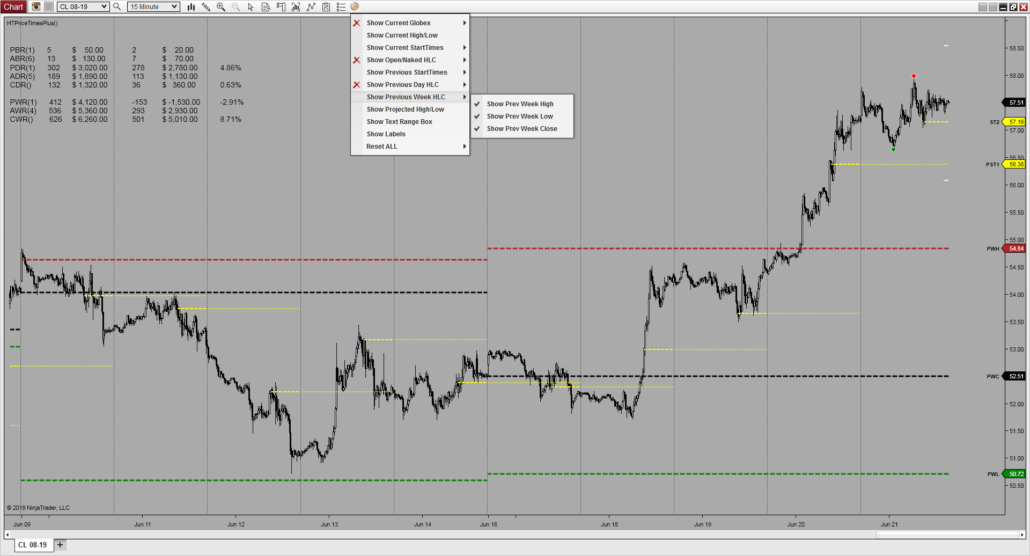
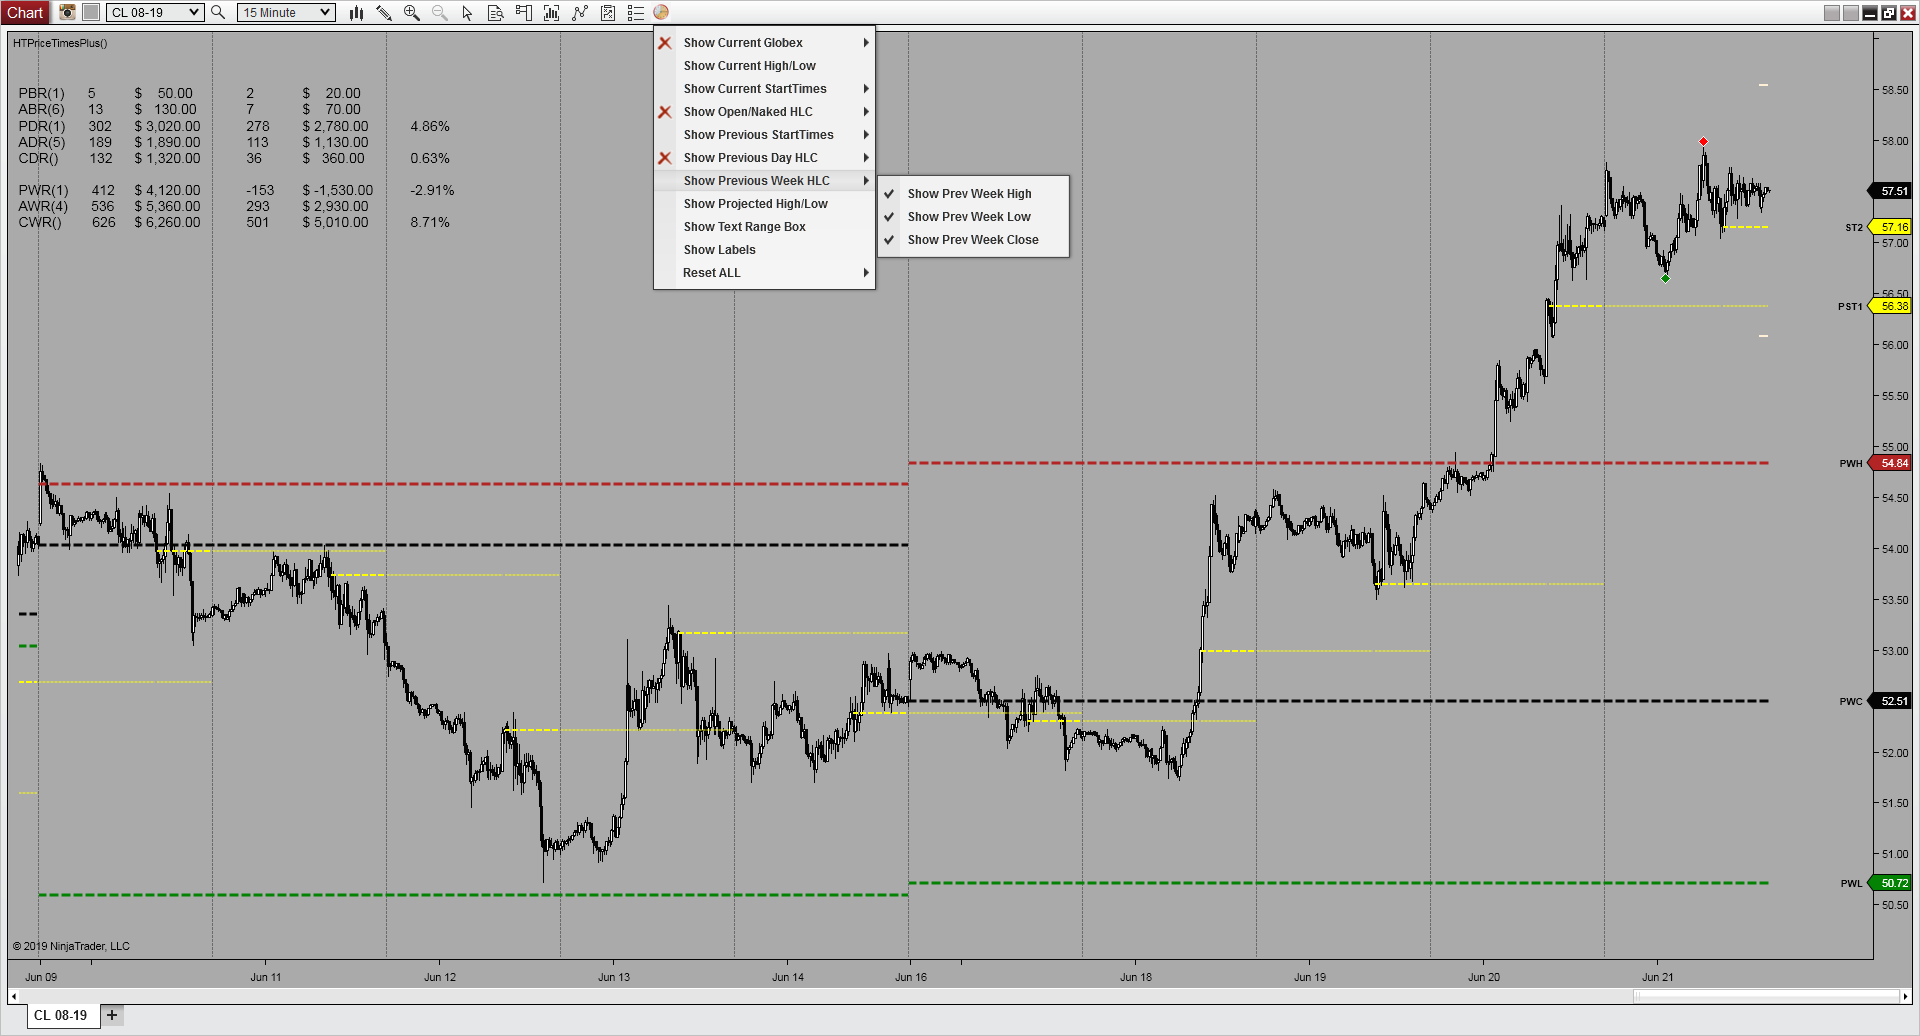
The summary box is a small text panel you can drop into any corner of the chart. It reports eight ranges: the previous bar and the average bar, then the previous day, the average day, and the day in progress, then the previous week, the average week, and the week in progress.
Each row carries more than a tick count. Price Times Plus converts the range into currency for the instrument you are actually trading, and reports the net change beside it in both ticks and dollars, with a percentage added on the daily and weekly rows. So the average daily range does not read as a bare 189. It reads as 189 ticks and $1,890.00 on the same line, before you size anything.
The averages use lookbacks that you set, which is why the labels carry their counts. ABR(6) is the last six bars, ADR(5) the last five days, and AWR(4) the last four weeks.
Bar
Previous bar range.
Average bar range.
Day
Previous day range.
Average day range.
Current day range.
Week
Previous week range.
Average week range.
Current week range.
Opening ranges, open levels, and net-change regions
Three opening ranges are drawn for you. OR1 arrives as a rectangle. OR2 and OR3 arrive as Fibonacci tools, so the range projects its own levels above and below itself instead of simply boxing the period in. Each of the three takes a NinjaTrader drawing template by name, which means an opening range appears already wearing the colors and styles you use everywhere else on your charts. Leave the template blank and the tool falls back to its own default.
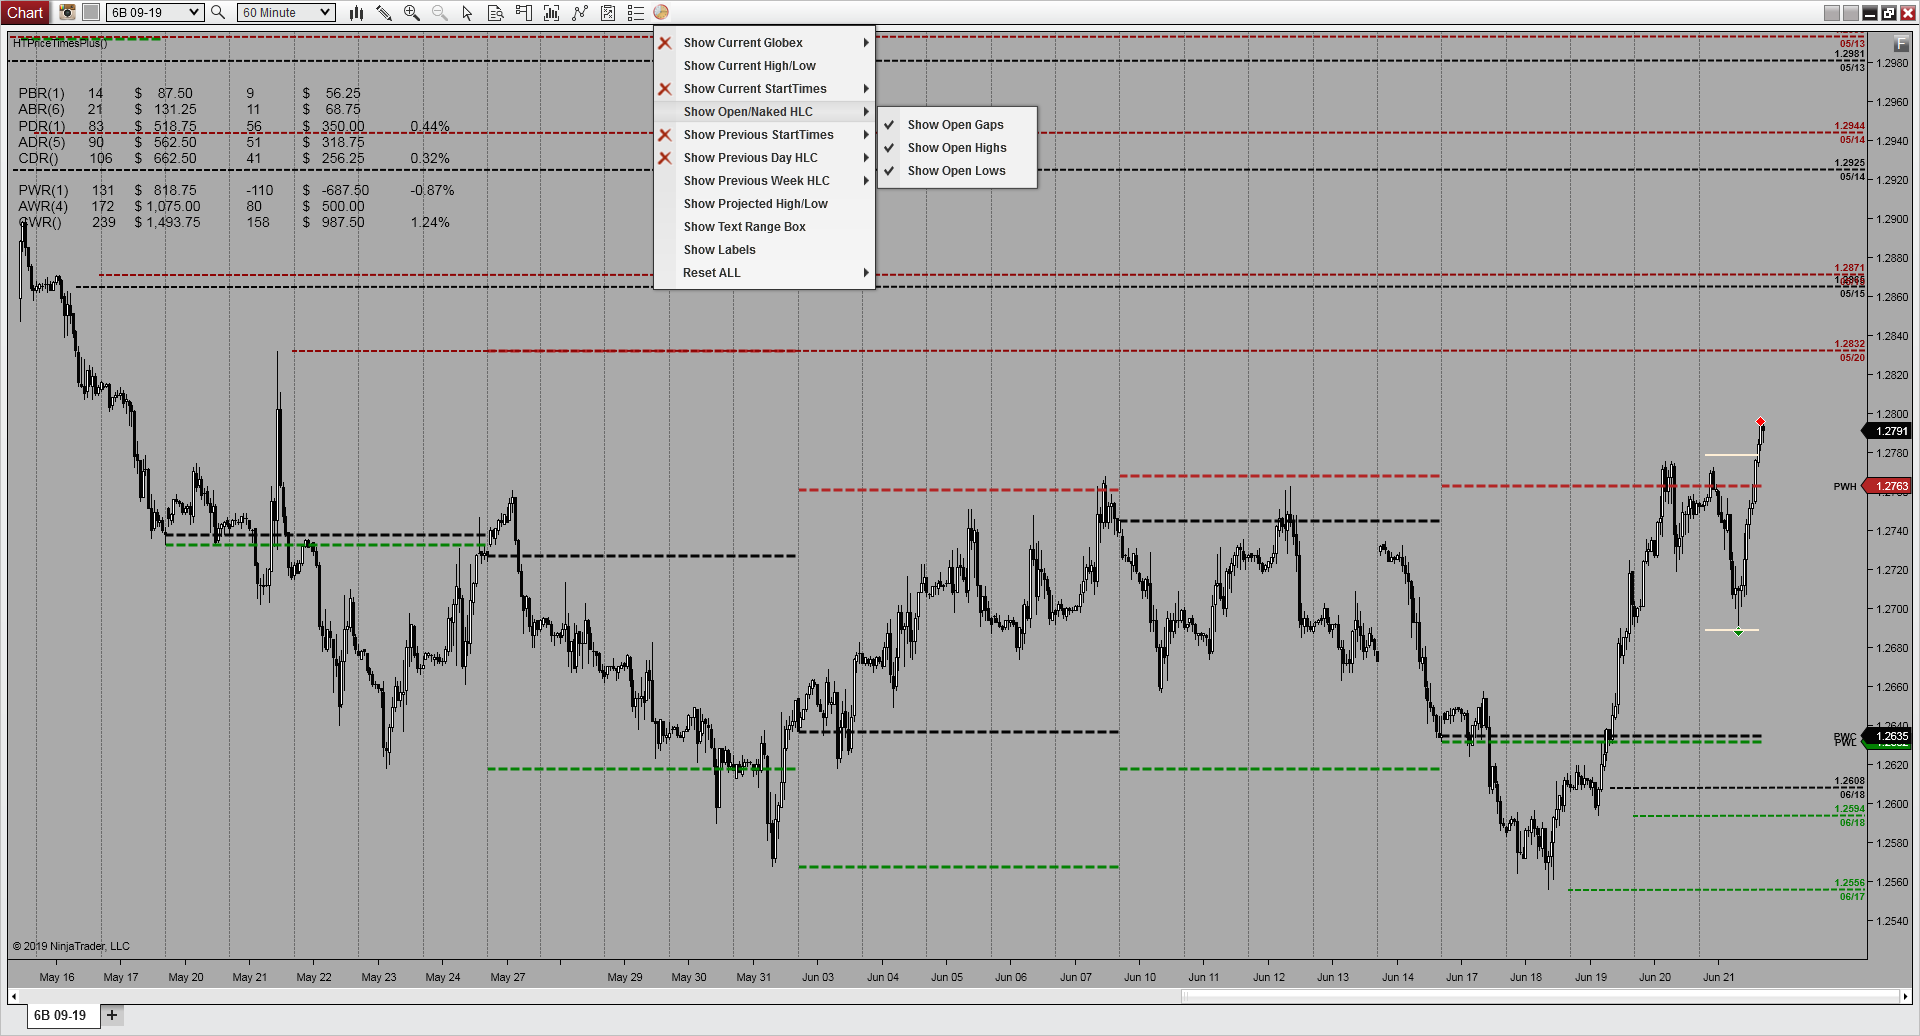
Open and naked levels are the highs, lows, and closes that price walked away from and has not come back to trade through. Price Times Plus tracks them as open gaps, open highs, and open lows, carries them forward across the chart, and lets them go once price finally fills them.
Net-change regions shade a session against its own close. One band reaches up from the close to the session high, another reaches down to the session low, and a line marks the close itself. It is a fast read on how far a session actually travelled in each direction, rather than only where it happened to finish.
Start times: three moments of the day, down to the minute
Most levels indicators decide for you which moments of the day are worth marking. Price Times Plus hands that back. You pick three times, to the minute, and it marks the opening price at each of them on the current day and again on the previous day, giving you six of the thirty-five levels that nobody else’s defaults could have guessed.
The times that ship with it are an example, not an instruction. 8:00am for the crude open, 8:30am for the equities open, 10:30am for the Euro close. If the moments you actually trade around are a report release, the London fix, or your own cutoff for the morning session, those are the three you set instead.
Worth being precise about one thing: these are start times, not sessions. Price Times Plus reads whatever session template your chart is already using and marks your chosen times inside it.
Why traders use Price Times Plus in NinjaTrader 8
The reason is not the level count on its own, it is the control. Price Times Plus puts every reference level you keep going back to on a NinjaTrader 8 chart, and lets you show only the handful you want at any given moment.
Without Price Times Plus
- Load one indicator for daily levels, another for weekly, another for the opening range.
- Open a properties window and reapply the indicator every time a line needs to go.
- Work out in your head what the day’s range is actually worth in dollars.
With Price Times Plus
- Thirty-five levels, the opening ranges, and the open levels all come from one indicator.
- One toolbar icon shows or hides any of them while the chart keeps running.
- The summary box reports every range in ticks, dollars, and percent for you.
Will 35 levels clutter my chart?
Only if you ask them to. Nothing is forced on. Every level has its own switch in the toolbar menu, so most traders keep a handful on screen and leave the rest sitting there for the days they want them.
Do I have to reload the chart after changing what is displayed?
No. Anything you change from the toolbar menu takes effect on the chart immediately. There is no properties window to reopen and no reapplying the indicator.
Do the levels change if I switch chart intervals?
No. Yesterday’s high is yesterday’s high whether you are looking at a one minute chart or a sixty minute chart, and Price Times Plus plots the same values on whatever interval you apply it to.
Can I keep my own colors and line styles?
Yes. Every plot carries its own color, style, and width, and the three opening ranges take your own NinjaTrader drawing templates by name so they match the rest of your chart.
Does it work on any instrument?
Yes. Price Times Plus works on any instrument you can put on a NinjaTrader 8 chart. If you also want a session VWAP alongside these reference levels, VWAP Plus is built for the same charts.
Requirements: Windows and NinjaTrader 8.1.2.1 or later.


Jimmy (verified owner) –
This is the best product for determining daily/weekly/monthly OHLC and many more levels on basically any bar type. The updated version has more bells and whistles including the ability to import the levels overs to NT8 Market Analyzer. Tech support was extremely helpful in getting my custom script up and running with PriceTimePlus.
Overall this is a great product which I use daily in all of my charts. Would highly recommend this product to anyone who wants to visualize price levels on their charts.
Mailman (verified owner) –
This is another solid product, clean, and fast, with useful information for real-time decisions in trading. The only improvement I’d like to see is how line overlaps are drawn. As examples, let’s say yesterday’s low is the same as today’s high (even within a few ticks); or, one has multiple VWAPs (daily, weekly) on a single chart and one of these levels overlay. Today, those overlaid line labels are unreadable. I would suggest if two occur near each other to create a single line, then the indicator place one label immediately above and the other immediately below the line. If there are 3 that converge, then sort by label name, place the middle one on the line, and the other two above and below. Rarely have I seen more than 3. I’d suggest it be a custom option (e.g. Overlap Lines: yes/no) so those who like discrete levels can leave it as it is; the rest of us who trade within zones won’t care if the aggregate of the 3 lines (all within a few ticks of each other) is slightly off due to the spacing. But, all vendors I’ve seen currently do this so top grades for HT. If anyone can figure out how not to step on their own labels, I know High Tech can.
roger (verified owner) –
very useful and efficient tool for specific times the drop down menu makes this a must if this is used in your trading.
zohar (verified owner) –
I bought NT7 version of PriceTimes Plus some time ago, and now have also purchased NT8 version. Very helpful for trading planning levels and gaps. Nice and fast service without a doubt. Recommend this indicator to anyone who wants to be precise in levels. I work as a scalper, and it does fit the method. Thanks for the service!