

Included in All Access: one membership gives you this tool plus the full HTech NinjaTrader 8 suite.
A NinjaTrader 8 volume profile for any stretch of history you choose
A time-based chart tells you where price went. It does not tell you where the trading actually happened. A volume profile turns a stretch of the chart on its side and measures how much volume traded at every price, so the prices the market kept coming back to stand out from the ones it passed straight through.
That is where the levels come from. The Point of Control is the price that traded the most volume, the fairest price in the range. The value area is the band around it, by default 70 percent of the range’s volume, where the bulk of the business got done. Its high and low edges are where the market stopped agreeing, which is why traders watch them when price comes back.
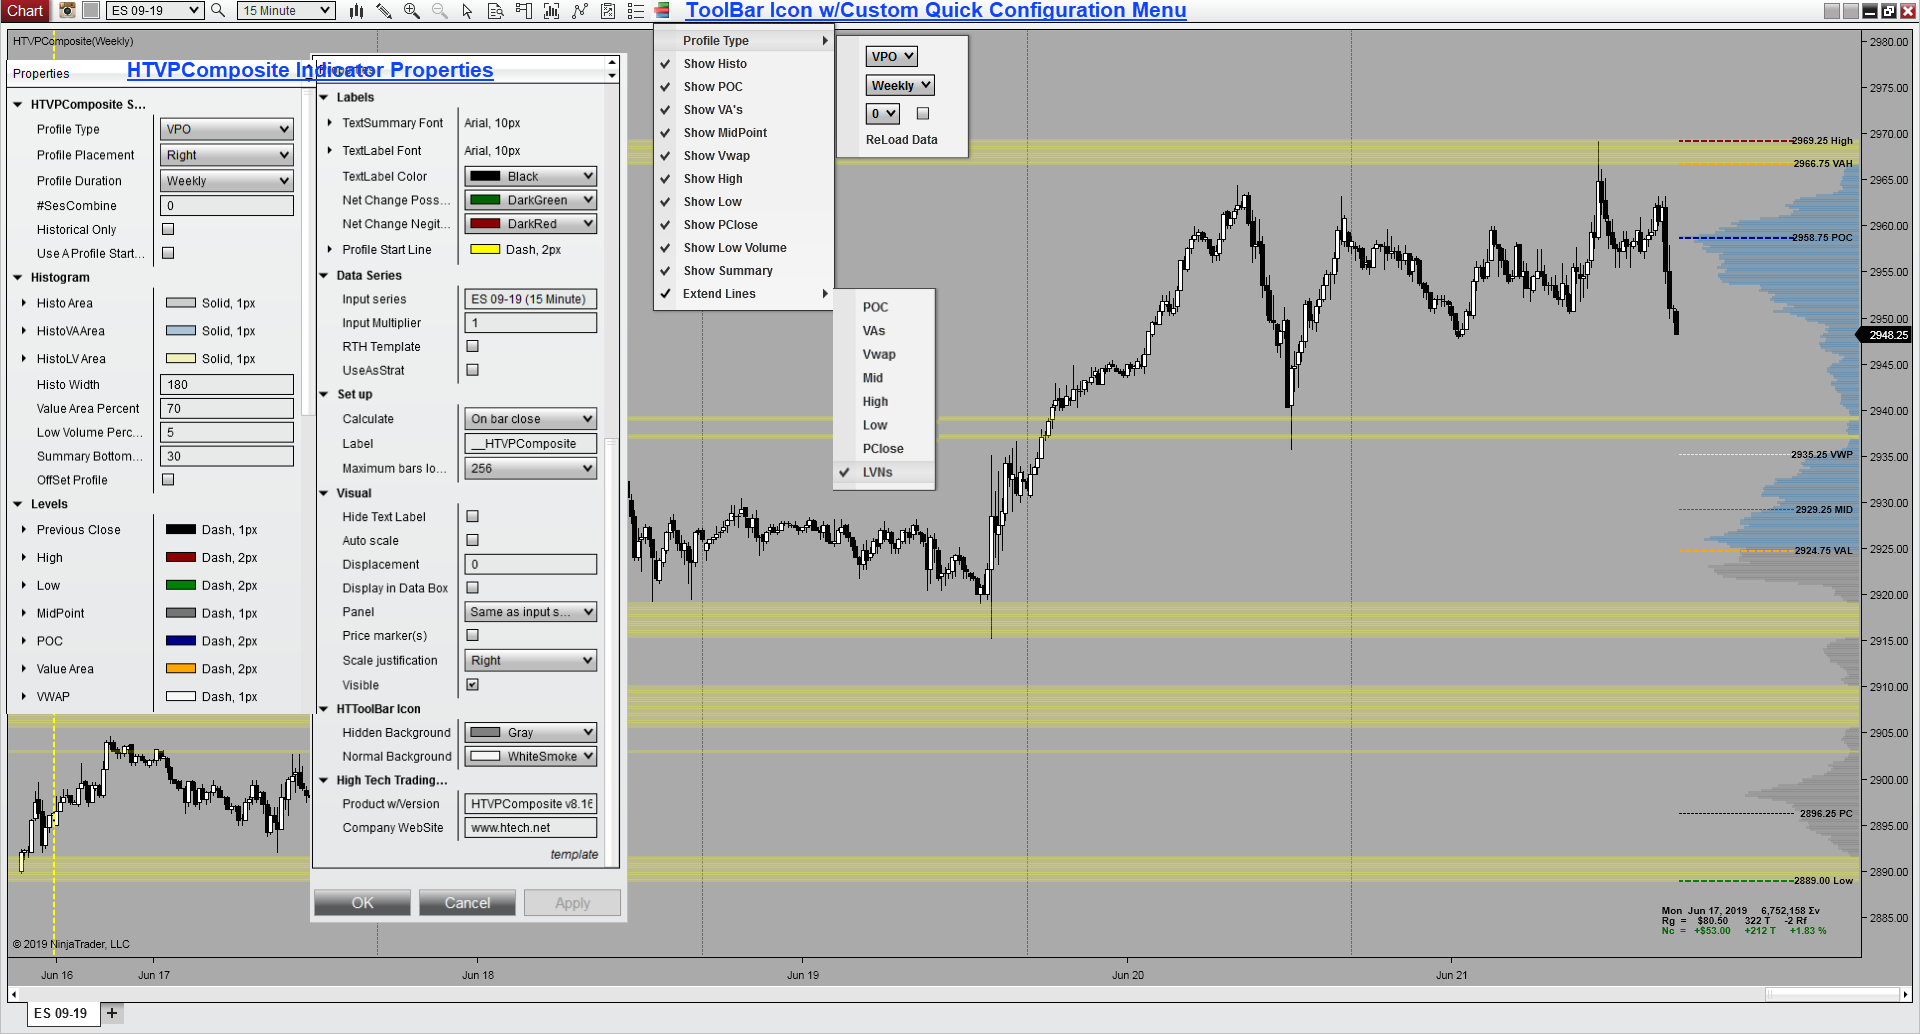
Volume Profile Composite builds one NinjaTrader 8 volume profile over exactly the stretch of history you want to study. Today, this week, the last two months, the whole contract, the entire chart, or the span between two dates you pick. One profile, one set of levels, over the range that matters to you.
Set how far back the profile reaches
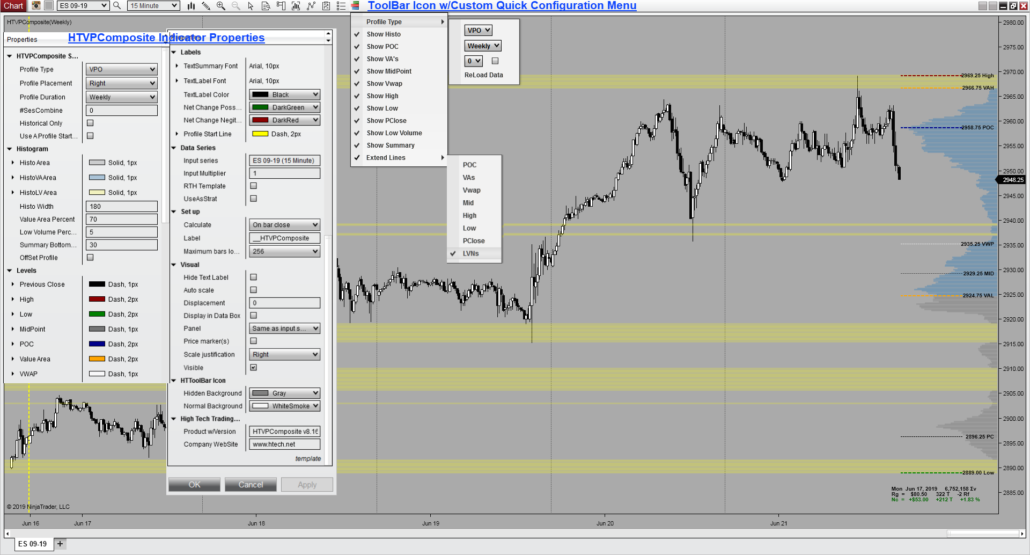
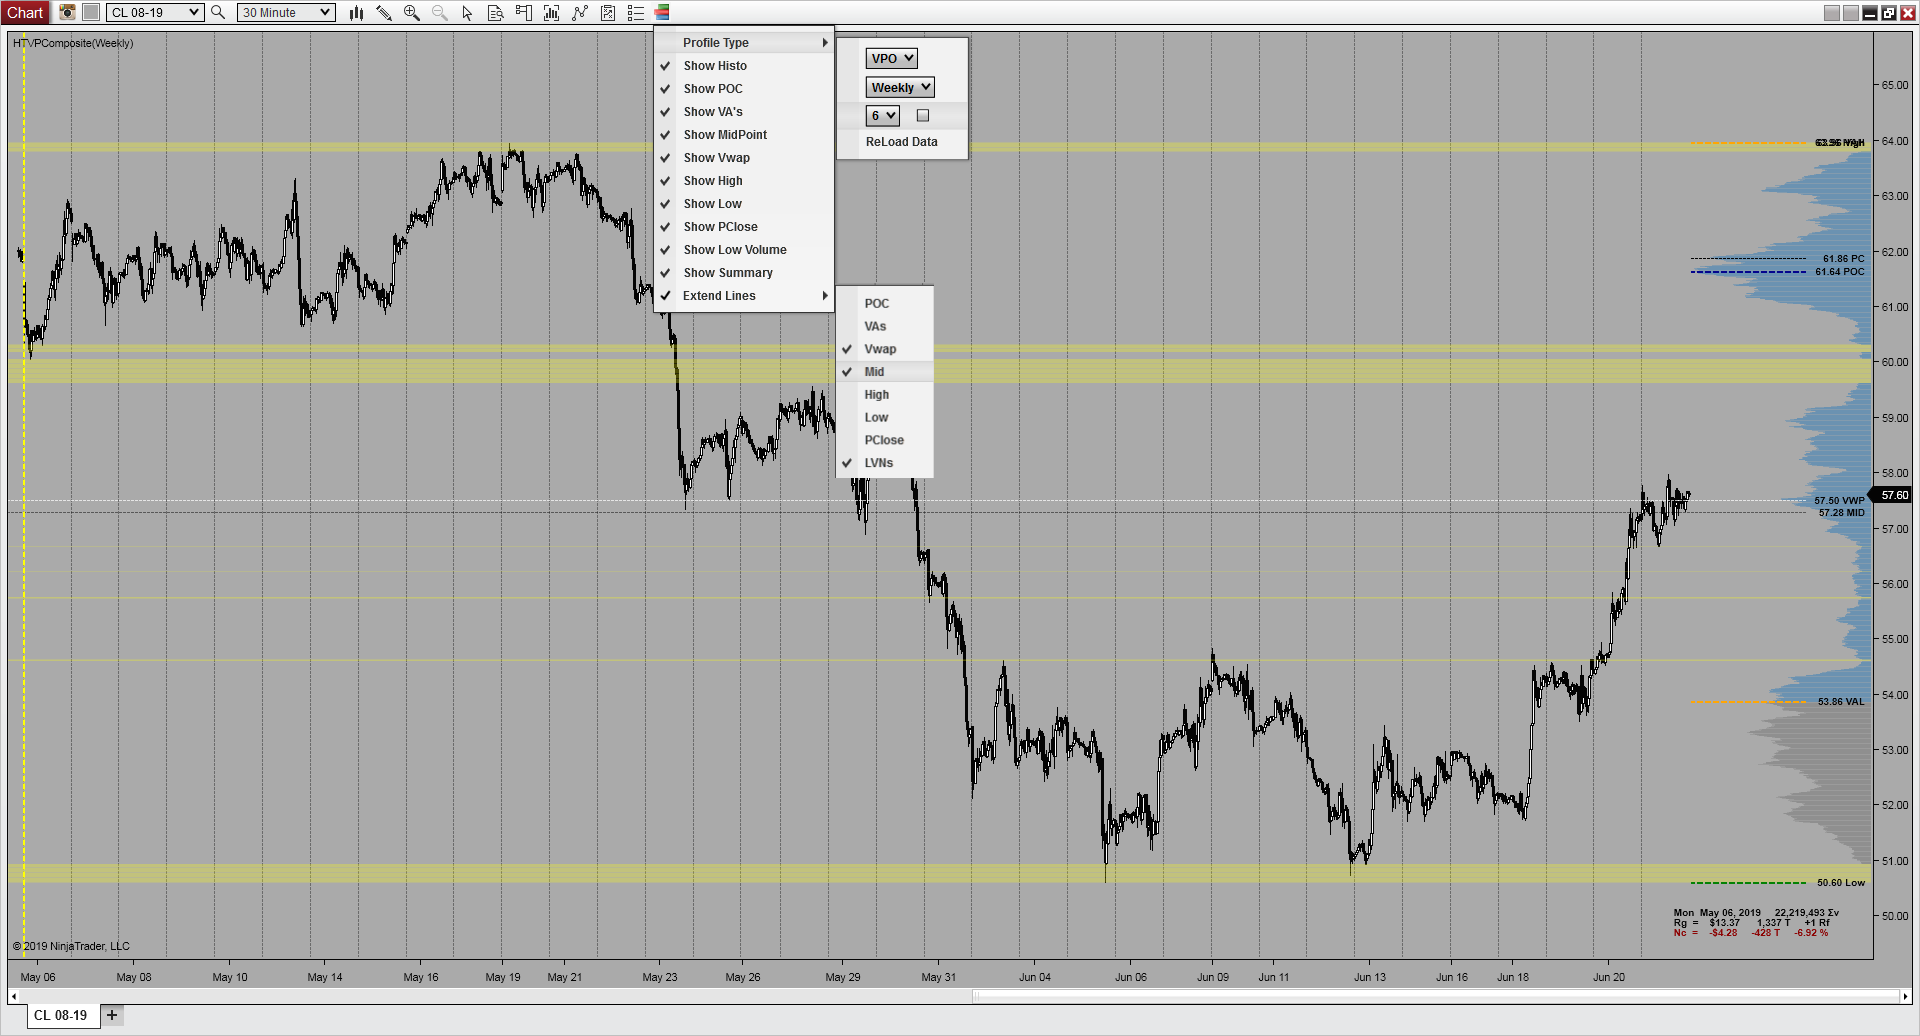
Pick a period, then pick how many prior periods to add to it. Zero profiles the current period on its own. Six on a daily setting reaches back six trading days, and weekends do not count against you: Saturday is not a trading day and Sunday belongs to Monday. Six on a weekly setting reaches back six weeks instead. The count runs to ten, because past ten days you are better served switching the period to weekly than stacking more days.
Once it is set, the window looks after itself. As each new day or week begins, the profile re-anchors and slides forward, so a six-day lookback stays a six-day lookback without you touching it.

Read the histogram, then the levels
A NinjaTrader 8 volume profile is only as good as the levels you read from it. The histogram shows relative activity at each price in the selected range. The Point of Control is the fattest row. Value Area, VAH, VAL, VWAP, previous close, profile high, low, and midpoint turn that profile into levels you can keep visible as price moves.
Value structure
POC, Value Area, VAH, and VAL show where the range’s activity concentrated.
Chart references
VWAP, previous close, range high, low, and midpoint keep it in price context.
Range summary
Start date, total volume, rotational factor, total range, and net change.
Study a finished stretch without today bleeding into it
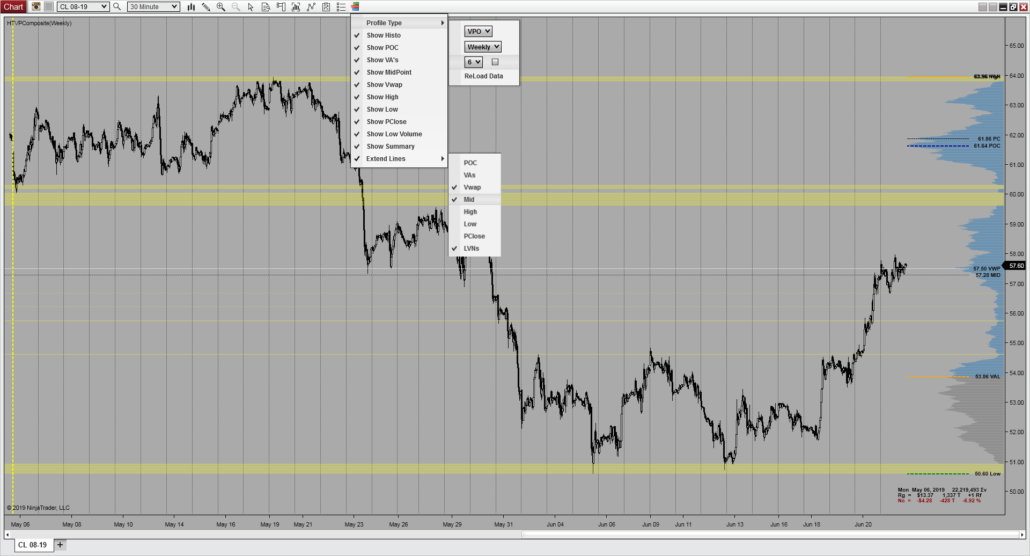
Sometimes the range you care about is over. Turn on historical only and the developing period drops out, leaving the completed range on its own: last week’s profile without this week’s trading pulling on it, or yesterday’s without today’s. A second yellow line appears to mark the end, so the profile is fenced at both ends and you can see exactly what it covers.
When you want an exact window rather than a rolling one, set a start date and an end date and the profile holds to it.
How Composite differs from Sessions
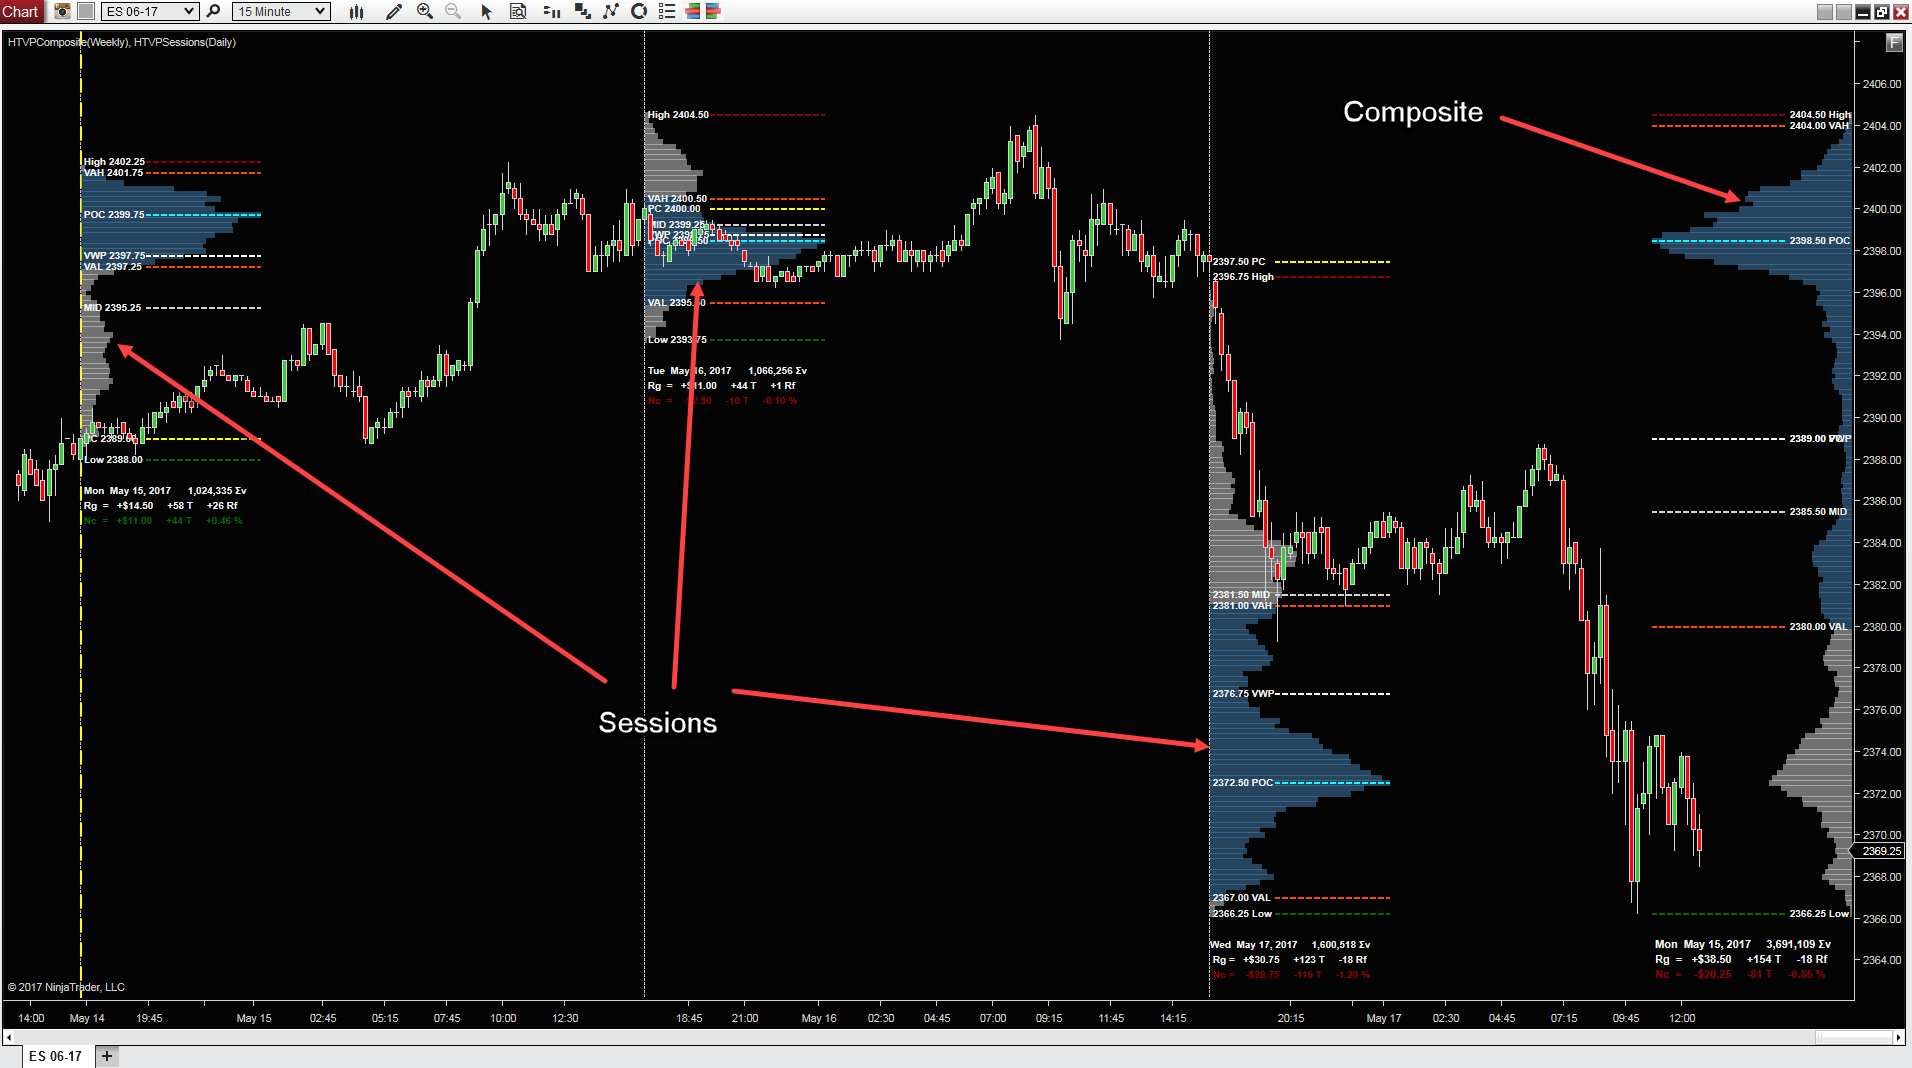
Both draw the same NinjaTrader 8 volume profile from the same trades, and the difference is only where the range begins and ends. Sessions cuts the chart at each session boundary and profiles every session it finds. Composite ignores boundaries and profiles one continuous stretch, however long you make it. Traders commonly run both: the sessions for structure day by day, the composite for the bigger picture sitting behind them.
Show only the levels you use
A chart toolbar icon puts the profile’s controls one click away. Switch off the levels you do not trade from, hide the histogram and keep the lines, or hold the lines to the width of the histogram and extend them across the chart when you want them as references. Middle-click the icon to hide the whole indicator at once, and middle-click again to bring it back.
Make the profile fit the chart
Put the histogram on the left or the right, set its width, and choose Classic, Heat, or HeatMap shading with the colors and opacity you want. Set the value area percentage, shade the low-volume prices, and lift the summary block off the bottom of the chart when something else is sitting there.
Composite follows the trading hours template on your chart’s data series, and it can override it. You can run extended-hours bars and still profile the regular-hours range.
Good fit for
- Reading one continuous stretch of history, a week, a couple of months, or a whole contract.
- Workflows built on POC, value area, VWAP, previous close, high, low, and midpoint levels.
- Studying a finished move on its own, with the developing period kept out of the profile.
Without Composite
- Decide by eye where a profile should start and stop, and redo it as the chart moves on.
- Read a finished move with today’s trading still pulling on the same levels.
- Guess at the range a profile actually covers once it is drawn.
With Composite
- Set the period and how far back it reaches, and the window slides forward on its own.
- Turn on historical only and read the completed range without the current period.
- Read the yellow lines, which mark exactly where the profile begins and ends.
How is Composite different from Volume Profile Sessions?
Composite builds one NinjaTrader 8 volume profile over a continuous stretch you choose. Sessions cuts the chart at each session boundary and profiles every session it finds. Many traders run both on one chart. If you are new to volume profile, Sessions is the simpler place to start, because it needs no range decisions from you.
How far back can the profile reach?
Pick a period of daily, weekly, monthly, yearly, contract, or the whole chart, then add up to ten prior periods to it. You can also set an exact start and end date instead.
Can I profile a finished range without the current period in it?
Yes. Historical only drops the developing period, so you can read last week without this week, or yesterday without today.
How is it different from Volume Profile Dynamic?
Dynamic is for profiles you draw yourself on the chart. Composite is driven by the period, lookback, and date settings you choose.
Can I hide levels I do not use?
Yes. The toolbar can show or hide the histogram and each level on its own, and the levels you keep can be extended across the chart.
Requirements: Windows and NinjaTrader 8.1.2.1 or later.


Andrew Ittner (verified owner) –
Very lightweight, easy to customize, straightforward to use.
Vijay (verified owner) –
I bought dynamic, session & composite profiles. All 3 products are built taking into consideration in detail of what a trader wants from these profiles. They can be easily customized in detail also. Also, the support is too good & really appreciable. In short, I am loving it.
Mahesh (verified owner) –
Best Indicator i have Used ,has the best settings options.
Thanks to EDGE for creating such a Best Indicator and for Quick Support.
Gustavo (verified owner) –
Excellent product as well as excellent service when running into installation issues. I would certainly recommend it!
Christine (verified owner) –
This is a fabulous tool. Love the versatility of the options available with customizing the settings. thank you