
-
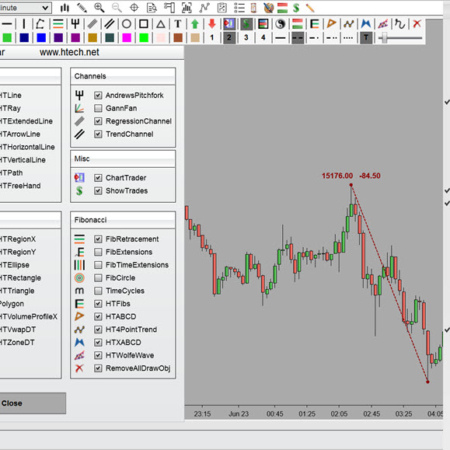
DrawBar – Ultimate
Original price was: $249.99.$199.99Current price is: $199.99. Save 20%– Add a Drawing ToolBar to any NinjaTrader Chart.
– Individually select the draw objects you'd like to display in Toolbar
– DropDown Icons for Easy User Selectable Options and Adjustments.
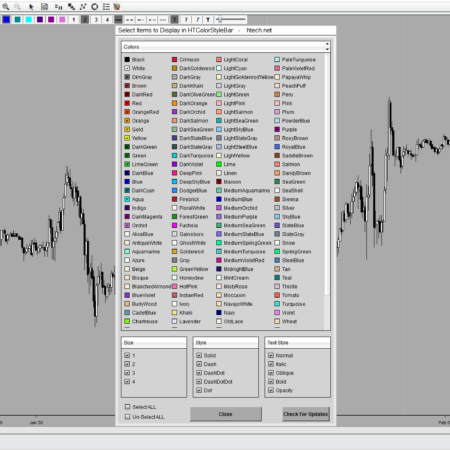
– Includes a Single Click Customizable Color/Style/Text Palette
– Selectable Mounting to the Top, Bottom, Left, or Right Hand Side
– Selectable Price Labels and Tick Offset Available for Most Draw Objects
– Selectable Auto Extend Rectangles to Far Right of Charts!
– Selectable Auto AB-CD Projections with Triangle and Pitchfork
– Selectable 50/100% Extensions Available on Most Draw Objects
– Selectable Fibonacci Zones Available on Triangle and Line (Coming Soon)
– Draw, Show, and/or Hide any Manually Drawn Object
– Show/Hide Ninja Trader Default Toolbar
– Show/Hide Trades Button
– Price Line Button
– Chart Pan Button– Customize and Label Any Draw Object with a Single Click!
– Added a build in WorkSpace Changer to Color/Style Palette!A MUST for any Serious Trader that Draws on Their Charts!
Absolutely Perfect for the Geometric Pattern or Fib Trader!
This is truly the Ultimate Drawing ToolBar for NinjaTrader 7!
-
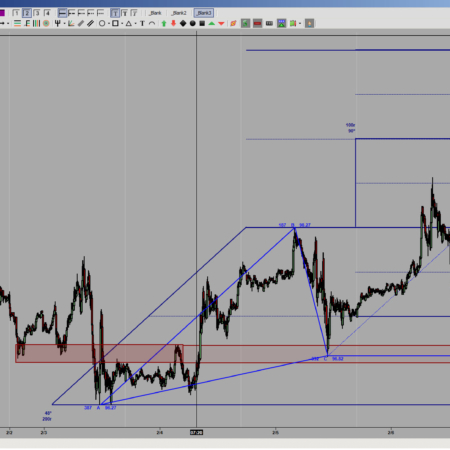
Pivots Plus
Original price was: $149.99.$99.99Current price is: $99.99. Save 33.34%Please Click on Image to View Products Description!
A Complete Product Description will be Added Here Very Soon!
-
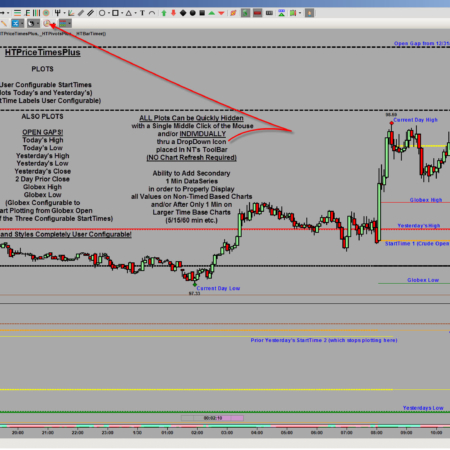
Price Times Plus
Original price was: $199.99.$149.99Current price is: $149.99. Save 25%Please Click on Image to View Products Description!
A Complete Product Description will be Added Here Very Soon!
-
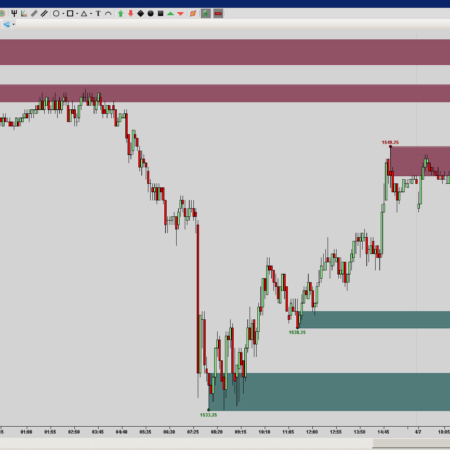
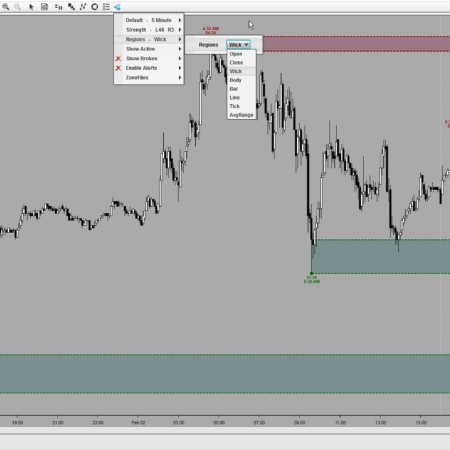
Supply & Demand
Original price was: $249.99.$199.99Current price is: $199.99. Save 20%– Calculates and Draws Supply and Demand Levels
– Calculates and Draws Swing High/Low's
– Individually Adjustable Look Back/Forward Strengths
– Hide or Shor Indictor with a Single Click
– Hide or Show Both Active and/or Broken Levels/Swings
– Hide or Show Price Labels for Levels/Swings/Dots
– Hide or Show Tick Offset Labels from Current Price
– Move or Remove Any Level/Swing on the Chart
– Turn On/Off Adjustable Alerts
– Auto Draw Fibs with selectable Bars Back (Beta).ToolBar DropDown Icon for Easy User Selectable Options and Adjustments Without Chart Refresh.
-
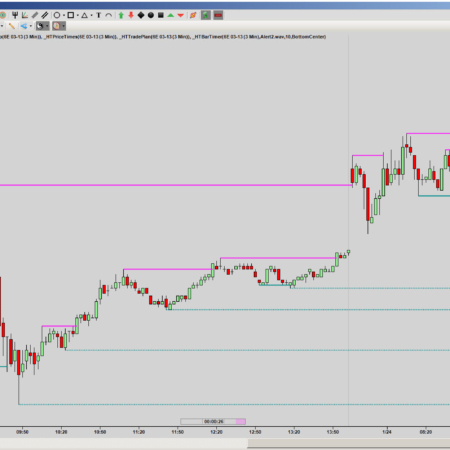
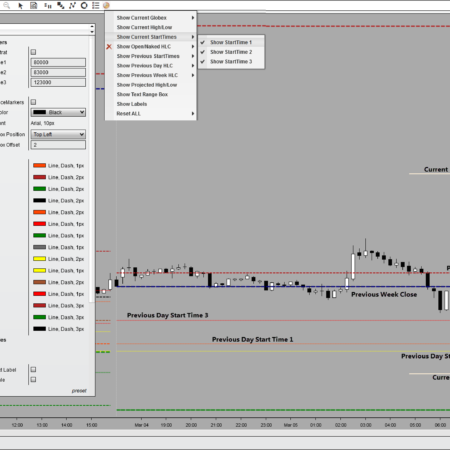
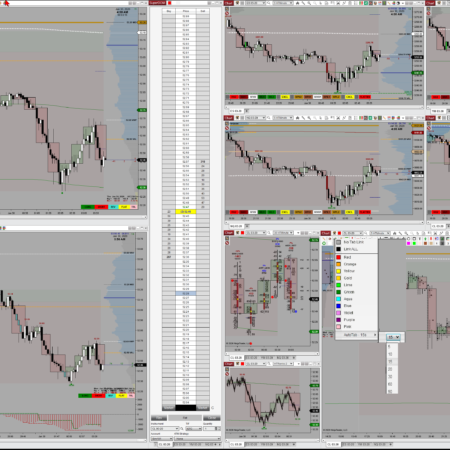
Supply & Demand (MTF)
Original price was: $399.99.$299.99Current price is: $299.99. Save 25%Our “Multi-TimeFrame Supply and Demand” Includes “ALL” the Same Features as our standard “Supply and Demand” and “Swing” Indicators. It Also Includes the Ability, with User Configurable Properties, to Apply the Indicator using your Default chart data series, “OR” to Choose Any Other Data Series you'd Like!
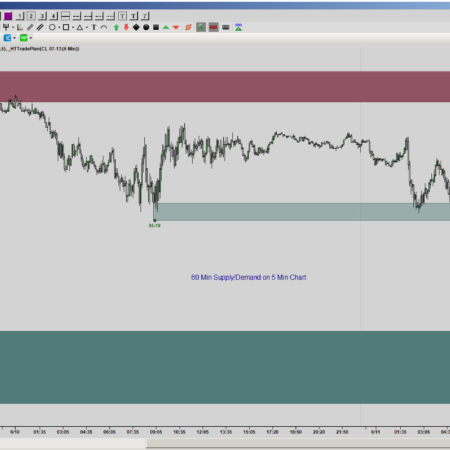
– Watch 60 min supply and demand on a 5 min chart:
– Watch 5000 volume supply demand on a 500 volume chart:
– Watch 610 tick supply demand on a 144 tick chart:“OR” You Can Even Mix and Match Data Series:
– Watch 15 min supply demand on a 610 tick chart:
– Watch Volume on Tick, Tick on Volume, Min on Range, etc:
– Works across any Data Series: (with the exception of custom bar types)ToolBar DropDown Icon for Easy User Selectable Options and Adjustments Without Chart Refresh.
-
Swings
Original price was: $129.99.$99.99Current price is: $99.99. Save 23.08%– Calculates and Draws Swing High/Low's
– Individually Adjustable Look Back/Forward Strengths
– Hide or Show Indicator with a Single Click
– Hide or Show Active and/or Broken Swings
– Hide or Show Price Labels for Swings or Dots
– Hide or Show Tick Offset Labels from Current Price
– Move or Remove Any Swing on the Chart
– Turn On/Off Adjustable Alerts
– Auto Draw Fibs with selectable Bars Back (Beta).ToolBar DropDown Icon for Easy User Selectable Options and Adjustments Without Chart Refresh.
-
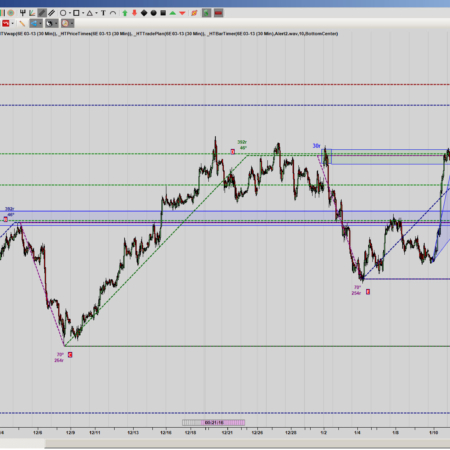
Swings Multi-TimeFrame
Original price was: $199.99.$149.99Current price is: $149.99. Save 25%Our “Multi-TimeFrame Swings” Includes “ALL” the Same Features as our standard “Swing” Indicator, but Also Includes the Ability, with User Configurable Properties, to Apply the Indicator using your Default chart data series, “OR” to Choose Any Other Data Series you'd Like!
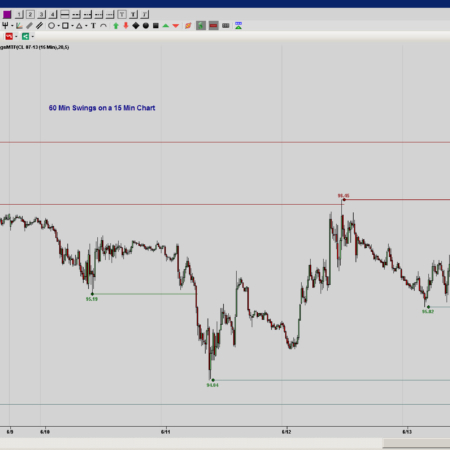
– Watch 60 min swings on a 5 min chart:
– Watch 5000 volume swings on a 500 volume chart:
– Watch 610 tick swings on a 144 tick chart:“OR” You Can Even Mix and Match Data Series:
– Watch 15 min swings on a 610 tick chart:
– Watch Volume on Tick, Tick on Volume, Min on Range, etc:
– Works across any Data Series: (with the exception of custom bar types) -
Trade Plan
Original price was: $149.99.$79.99Current price is: $79.99. Save 46.67%Trade Plan is a Unique Tool to Help you Plan and Analyze your Potential Trades..
– Individual Adjustable Contracts Size for up to 3 Targets
– Quantity Multiplier for Larger Size, Stock Traders, and/or Micro Forex
– Identifies Entry, Stops, and Targets
– Identifies Tick/Dollar Risk for Each Contract
– Identifies Tick/Dollar Reward for Each Contract
– Identifies Total Tick/Dollar Risk/Reward
– Identifies % of Account Size Risk/Reward
– Identifies Total Recommended Contract/Share Size
– Identified User Defined Trade Risk % of Account Size
– Identifies Total Trade Plan Summary
– Show/Hide Plan with Click of MouseToolBar DropDown Icon for Easy User Selectable Options and Adjustments.
Think – Plan – Trade
A Must Have For Any Serious Trader that Maps and Plans out Trades!
-
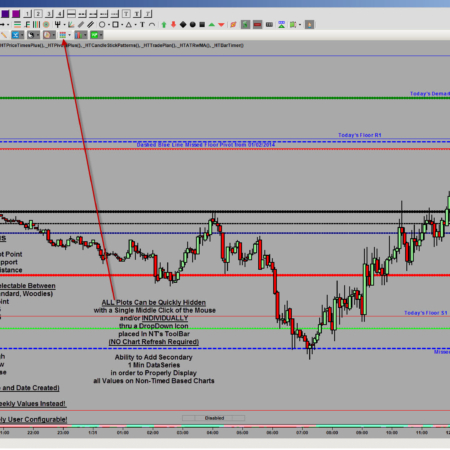
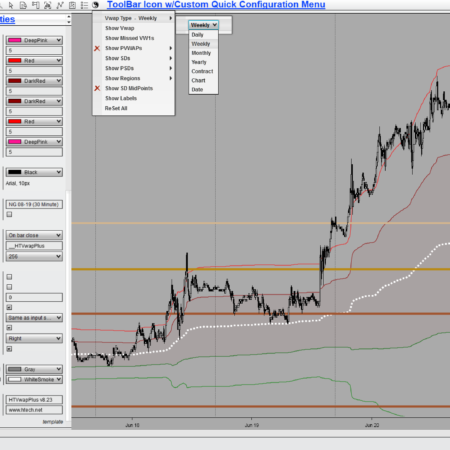
Vwap Plus
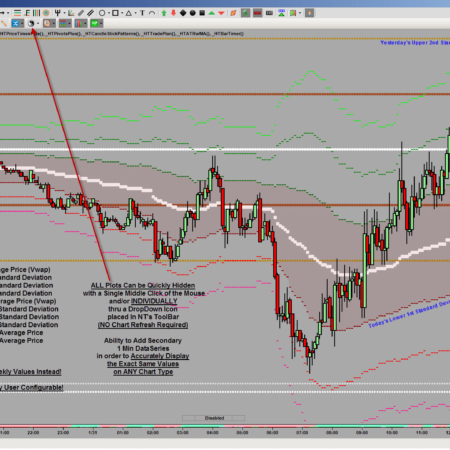
Original price was: $199.99.$149.99Current price is: $149.99. Save 25%– Today's Volume Weighted Average Price (VWAP)
– Today's 3 Unique Upper and Lower Standard Deviations of VWAP
– Yesterday's Volume Weighted Average Price (VWAP1)
– Yesterday's 1st 2 Upper and Lower Standard Deviations of VWAP1
– 2 Day Prior Volume Weighted Average Price (VWAP2)
– 3 Day Prior Volume Weighted Average Price (VWAP3)
– Missed/Naked Yesterday's VWAP1's
– ALL Plots Can be Quickly Hidden (INDIVIDUALLY and/or Altogether)
With a Single Mouse Click Thru a DropDown Icon Placed in NT’s ToolBar
– Accurately Display The Exact Same Values On ANY Chart Type!
– ALL Plot Colors and Styles are Completely User Configurable!
– Can Also Be Used to Plot ALL Above Weekly Values Instead!An Indicator I Wouldn't Want to Trade Without!
Recent Reviews
-
 Price Times Plus | NT8
by Jimmy
Price Times Plus | NT8
by Jimmy
-
 DrawBar Ultimate | NT8
by Tammo Eckert
DrawBar Ultimate | NT8
by Tammo Eckert
-
 Supply & Demand (MTF) | NT8
by Anthony Wood
Supply & Demand (MTF) | NT8
by Anthony Wood
-
 Color Style ToolBar | NT8
by Alex Koe
Color Style ToolBar | NT8
by Alex Koe
-
 Auto Tab Linking | NT8
by Alex Koe
Auto Tab Linking | NT8
by Alex Koe
-
Auto Tab Linking | NT8
by Randy Campbell
-
 Vwap Plus | NT8
by Derek Richards
Vwap Plus | NT8
by Derek Richards
Best Sellers
-
 Supply & Demand (MTF) | NT8
Original price was: $399.99.$299.99Current price is: $299.99.
Supply & Demand (MTF) | NT8
Original price was: $399.99.$299.99Current price is: $299.99.
-
 Auto Tab Linking | NT8
Original price was: $199.99.$149.99Current price is: $149.99.
Auto Tab Linking | NT8
Original price was: $199.99.$149.99Current price is: $149.99.
-
 Volume Profile Sessions | NT8
Original price was: $199.99.$149.99Current price is: $149.99.
Volume Profile Sessions | NT8
Original price was: $199.99.$149.99Current price is: $149.99.
-
 DrawBar Ultimate | NT8
Original price was: $399.99.$299.99Current price is: $299.99.
DrawBar Ultimate | NT8
Original price was: $399.99.$299.99Current price is: $299.99.
-
 Vwap Plus | NT8
Original price was: $199.99.$149.99Current price is: $149.99.
Vwap Plus | NT8
Original price was: $199.99.$149.99Current price is: $149.99.
-
 Double Click Zones | NT8
Original price was: $299.99.$199.99Current price is: $199.99.
Double Click Zones | NT8
Original price was: $299.99.$199.99Current price is: $199.99.
-
 Volume Profile Composite | NT8
Original price was: $199.99.$149.99Current price is: $149.99.
Volume Profile Composite | NT8
Original price was: $199.99.$149.99Current price is: $149.99.