Free Trials involve an incredible amount of time and support! Regretfully, spare time seems to be an extremely scares commodity!! As an Alternative, I’m offering this monthly subscription service as a Low Risk Means to Test For Yourself, before you Purchase!!!
Any Time in the First 30 Days!!
“You Like What You See”!!!!
“Would Like to Purchase”!!!
Your Initial Subscription Fee Will Be Discounted from the price of the Product being Purchased!!!
If at Any Time, for Whatever Reason.. You’d rather not continue or purchase at that time.. No Worries at All.. Just cancel the subscription, uninstall the product when it expires, and all your out is a small nominal fee to help cover my time and support.
I believe this to be a fair compromise.. I don’t end up wasting my time with thousands of people just searching for the next Freebies, and You’ll Never Spend a lot of money (not that my products are expensive) on something you might end up not wanting after all..
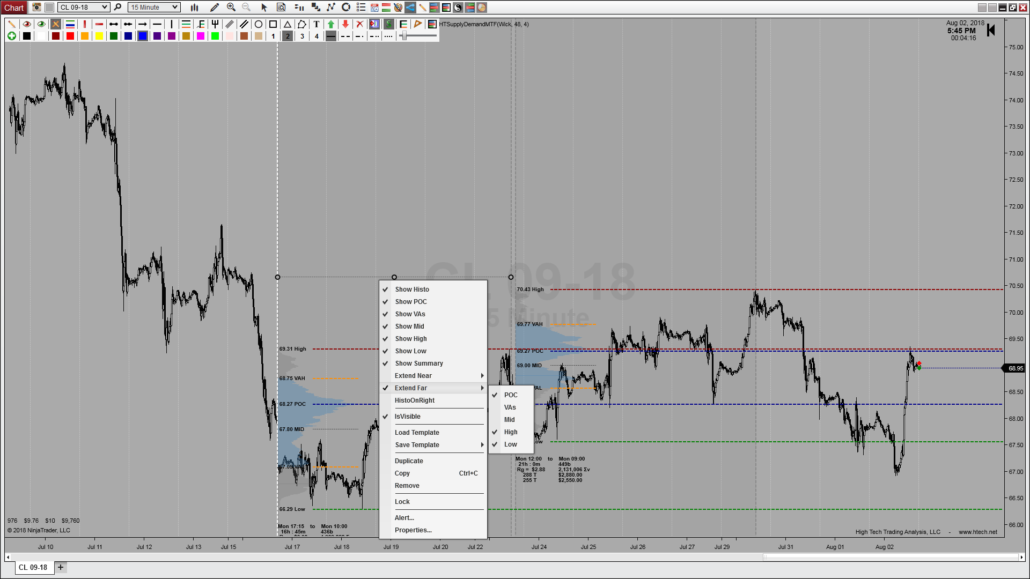
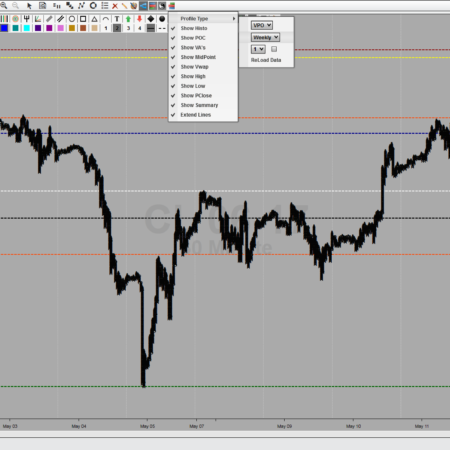
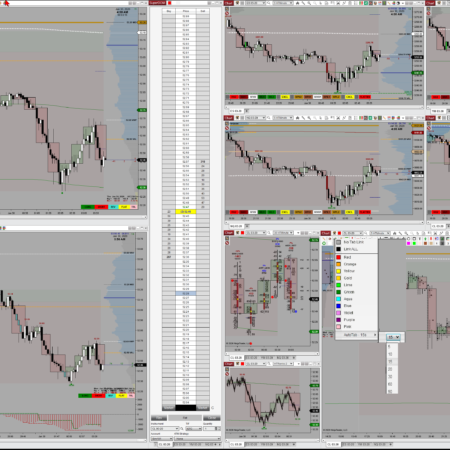
Volume Profile is an advanced charting technique that displays trading activity (Volume), accumulated over a specified time period, at specified price levels. This technique plots a histogram on the chart meant to reveal dominant and/or significant price levels based on Volume at Price over a specified period of Time. Essentially, Volume Profile compares and calculates the total volume traded at a specific price level during the specified time period, to the total overall volume for that same period. Then represents and displays this information as a vertical histogram making it easily visible to the trader.
“Dynamically Draw Volume Profiles” | AnyWhere on your Chart!
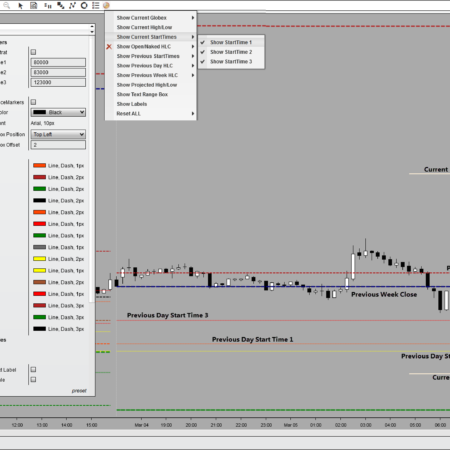
Calculated and Displayed Levels of Significance:
Value Area (VA) – Price Range of Specified Percentage from Profile Volume
Value Area High (VAH) – Highest Price Level of Profile Value Area
Value Area Low (VAL) – Lowest Price Level of Profile Value Area
Point of Control (POC) – Price Level of highest traded volume in Profile
Volume Weighted Avg Price (VWAP) – Price Level of Profile Vwap
Previous Close (PC) – Last Closing Price Before Profile Start DateTime
Profile High (HIGH) – Highest Price Reached of Profile Duration
Profile Low (LOW) – Lowest Price Level Reached of Profile Duration
Profile MidPoint (MID) – Midpoint Price level of Profile Duration
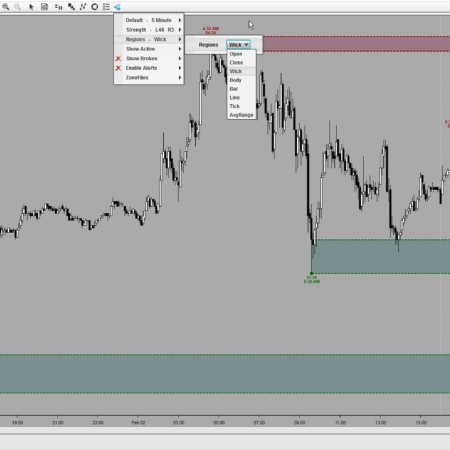
Dynamic Profile Indicator Properties Settings
– Profile Type – Volume (VPO) or Time (TPO) (Beta)
– Profile Duration – Choose Between 5 Different Profile Session Types
– (Days, Weeks, Months, Years, and/or even Contract Expiration)
– Value Area Percent – User Configurable from 0 to 100 percent
– Histo Placement – Configurable to Display on Left or Right of Profile
– Histo Width – User Configurable in static pixels
– Histo Color – User Configurable to any Color and any Opacity
– Histo VA Color – User Configurable to any Color and any Opacity
– Levels All – Independent user Configurable Colors, Style, and Widths
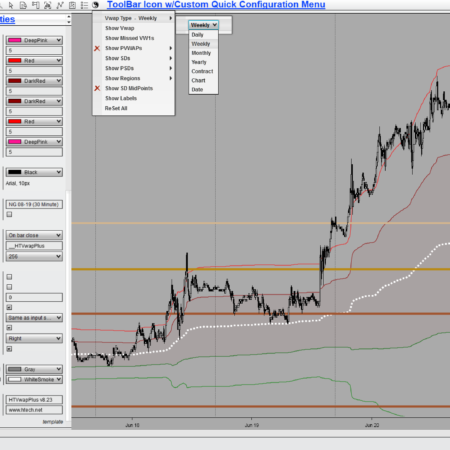
Dynamic Profile ToolBar Icon DropDown Menu Settings
– Access DropDown Menu with a Single Click for Quick/Easy Configurations
– Histo – Configurable to Display on Left or Right of Profile
– Histo – Hide or Show Profile Histogram with Simple Click
– Levels All – Independently Hide or Show any Level and/or Histogram
– Levels All – Levels can be extended across the entire chart area.
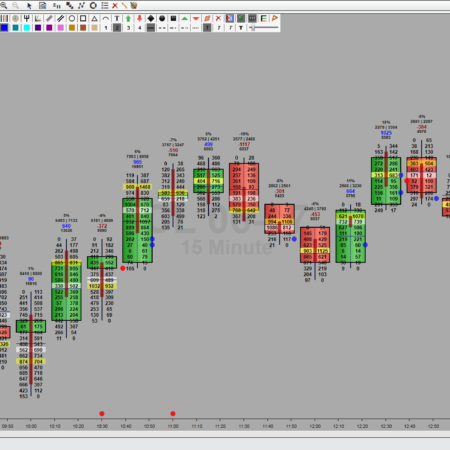
Additional Summary Information Displayed below Profile:
– Profile DateTime Start
– Total Volume
– Total Delta
– Rotational Factor
– Total Range in $$, Ticks
– Current Net Change in $$, Ticks, and Percentage
ALL Plots Can be Quickly Hidden (INDIVIDUALLY and/or Altogether)
– ALL Plot Colors and Styles are Completely User Configurable!
– ToolBar DropDown Icon for Simple & Easy User Configurations!
Volume Profile is an extremely valuable and versatile technical analysis tool that is used by trader’s all over the world. There are Numerous trading strategies out there using Volume Profile as a key component. One thing that many traders will use volume profile for is identifying basic support and resistance levels. To do this, the trader relies on, and analyses, past price movements and volume behavior. This type of methodology can be useful in assisting the trader to apply meaning or significance to price levels where the market has already visited.
The key to Volume Profile’s continued relevancy is its versatility. It is an advanced charting tool that truly does have a wide array of uses. Unlike many other techniques, there is little to no debate about Volume Profile’s usefulness. The data that is provided by Volume Profile is indisputable, leaving it to the trader to find new and creative ways to use it.
Individual Products
Individual HTech product purchases include a non-expiring license for the purchased product and one year of free updates from the date of purchase. After the update period ends, the product does not expire. You may continue using the version you already own, but future updates are not included unless a new update period, upgrade, or replacement license is purchased.
All Access
All Access is an annual access membership for eligible HTech NinjaTrader tools. It does not auto-renew and does not automatically bill again. When an All Access membership expires, All Access-only products expire unless you choose to purchase a new membership. Any individual products you purchased separately remain available under their own license terms.
Registration
HTech products require registration before they can be used, including free products. Registration may require your NinjaTrader Machine ID or other licensing information depending on the product. Please review the instructions provided after purchase or access for download, installation, and registration details.
License Use
Licenses are for the original purchaser only and may not be shared, transferred, resold, distributed, or used by multiple customers.
Refunds
HTech products are digital software products. Once a product has been purchased, downloaded, licensed, or accessed, the sale is final and non-refundable.
Support
Support is available through the HTech Discord support channel, Microsoft Teams when available, and direct support contact when needed. HTech makes a reasonable effort to respond within one business day, but support may be limited for third-party platform issues, computer setup, brokerage connections, discontinued products, or platform changes outside HTech’s control.
TradeStation
TradeStation products are discontinued and are no longer available for new purchases. Existing customers may continue using what they already purchased or licensed, but future updates are not planned and support may be limited.
My Account Downloads
After purchase or access, your available HTech downloads are located in your My Account page. Log in with the same account used for the purchase, then open the Downloads tab in My Account.
Installer Passwords
Most individual HTech products are delivered as password-protected self-installing files. The required installer password is included in your order email. If your order includes multiple products, that email may include multiple product passwords.
Please keep your order email in a safe place for future updates, reinstalls, or computer changes.
Machine ID Registration
All HTech NinjaTrader products require Machine ID registration before they can be used, including free products. Log in to My Account and use the NT8 Registration menu item to register your NinjaTrader Machine ID before starting NinjaTrader with the product installed.
Email Registration
The first time you run an HTech NinjaTrader product, you may be asked to enter your email address. Use the same email address registered on your HTech website account. This is normally a one-time step and should not be required again for regular product updates.
Installation Steps
Close NinjaTrader before installing or updating HTech products. Download your product installer, run the downloaded file, follow the installation prompts, and enter the installer password from your order email when prompted.
After installation, start NinjaTrader. If a Trusted Source message appears, accept it. After accepting the Trusted Source message, restart NinjaTrader once more.
Updates and Reinstalls
Do not uninstall previous versions before updating. HTech installers are designed to install over the existing version. After installing the update, open NinjaTrader and the product will be updated.
Individual product purchases include one year of free updates from the date of purchase. During the active update period, available updates can be downloaded from your My Account page.
All Access
All Access uses a separate installer and access model. Eligible HTech NinjaTrader tools are available while the All Access membership is active. If you already own individual HTech products, those separate purchases remain available under their own license terms. When All Access expires, All Access-only products expire and downloads/access end unless a new membership is purchased.
TradeStation
TradeStation products are discontinued and are no longer available for new purchases. Existing customers may continue using downloads they already purchased or licensed when available, but future updates are not planned and support may be limited.
Help
If you have trouble finding your download, locating your installer password, registering your Machine ID, or installing a product, please contact HTech support.
Detailed Explaination of ALL Features, Properties, Set-Up, and Configuration:
Detailed Explaination of ALL Features, Properties, Set-Up, and Configuration:
This is a Very Basic Explanation of How Volume Profile is Calculated and Displayed
Reviews
There are no reviews yet.
Be the first to review “Volume Profile Dynamic | NT8 | Subscription” Cancel reply


Reviews
There are no reviews yet.