
Product Description
Free Trials involve an incredible amount of time and support! Regretfully, spare time seems to be an extremely scares commodity!! As an Alternative, I’m offering this monthly subscription service as a Low Risk Means to Test For Yourself, before you Purchase!!!
Any Time in the First 30 Days!!
“You Like What You See”!!!!
“Would Like to Purchase”!!!
Your Initial Subscription Fee Will Be Discounted from the price of the Product being Purchased!!!
If at Any Time, for Whatever Reason.. You’d rather not continue or purchase at that time.. No Worries at All.. Just cancel the subscription, uninstall the product when it expires, and all your out is a small nominal fee to help cover my time and support.
I believe this to be a fair compromise.. I don’t end up wasting my time with thousands of people just searching for the next Freebies, and You’ll Never Spend a lot of money (not that my products are expensive) on something you might end up not wanting after all..
——————————————————————————————————————————————————–
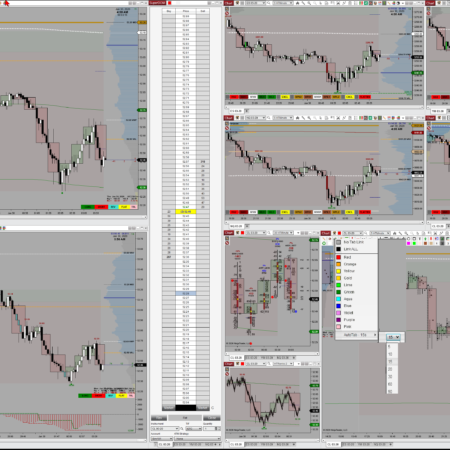
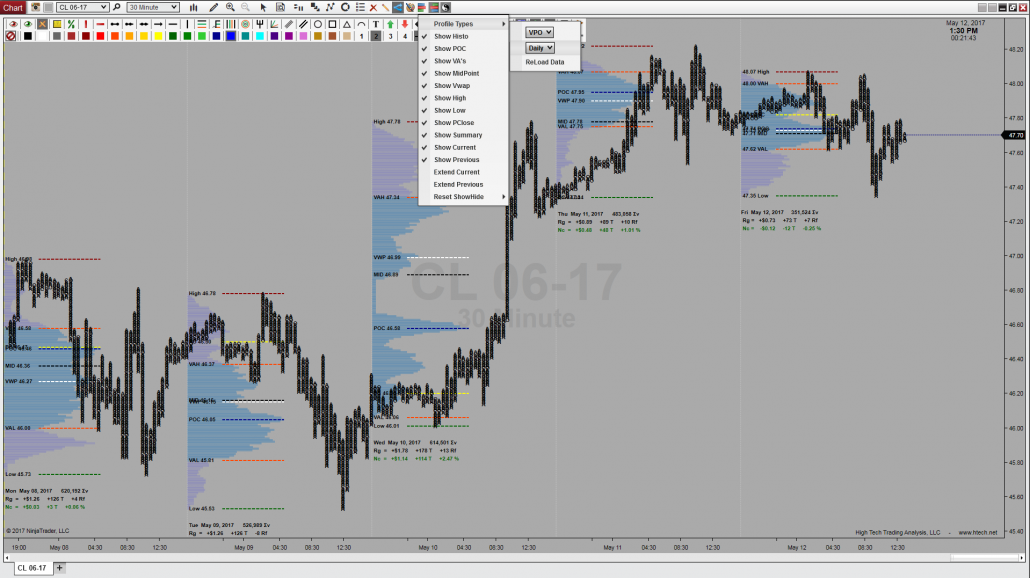
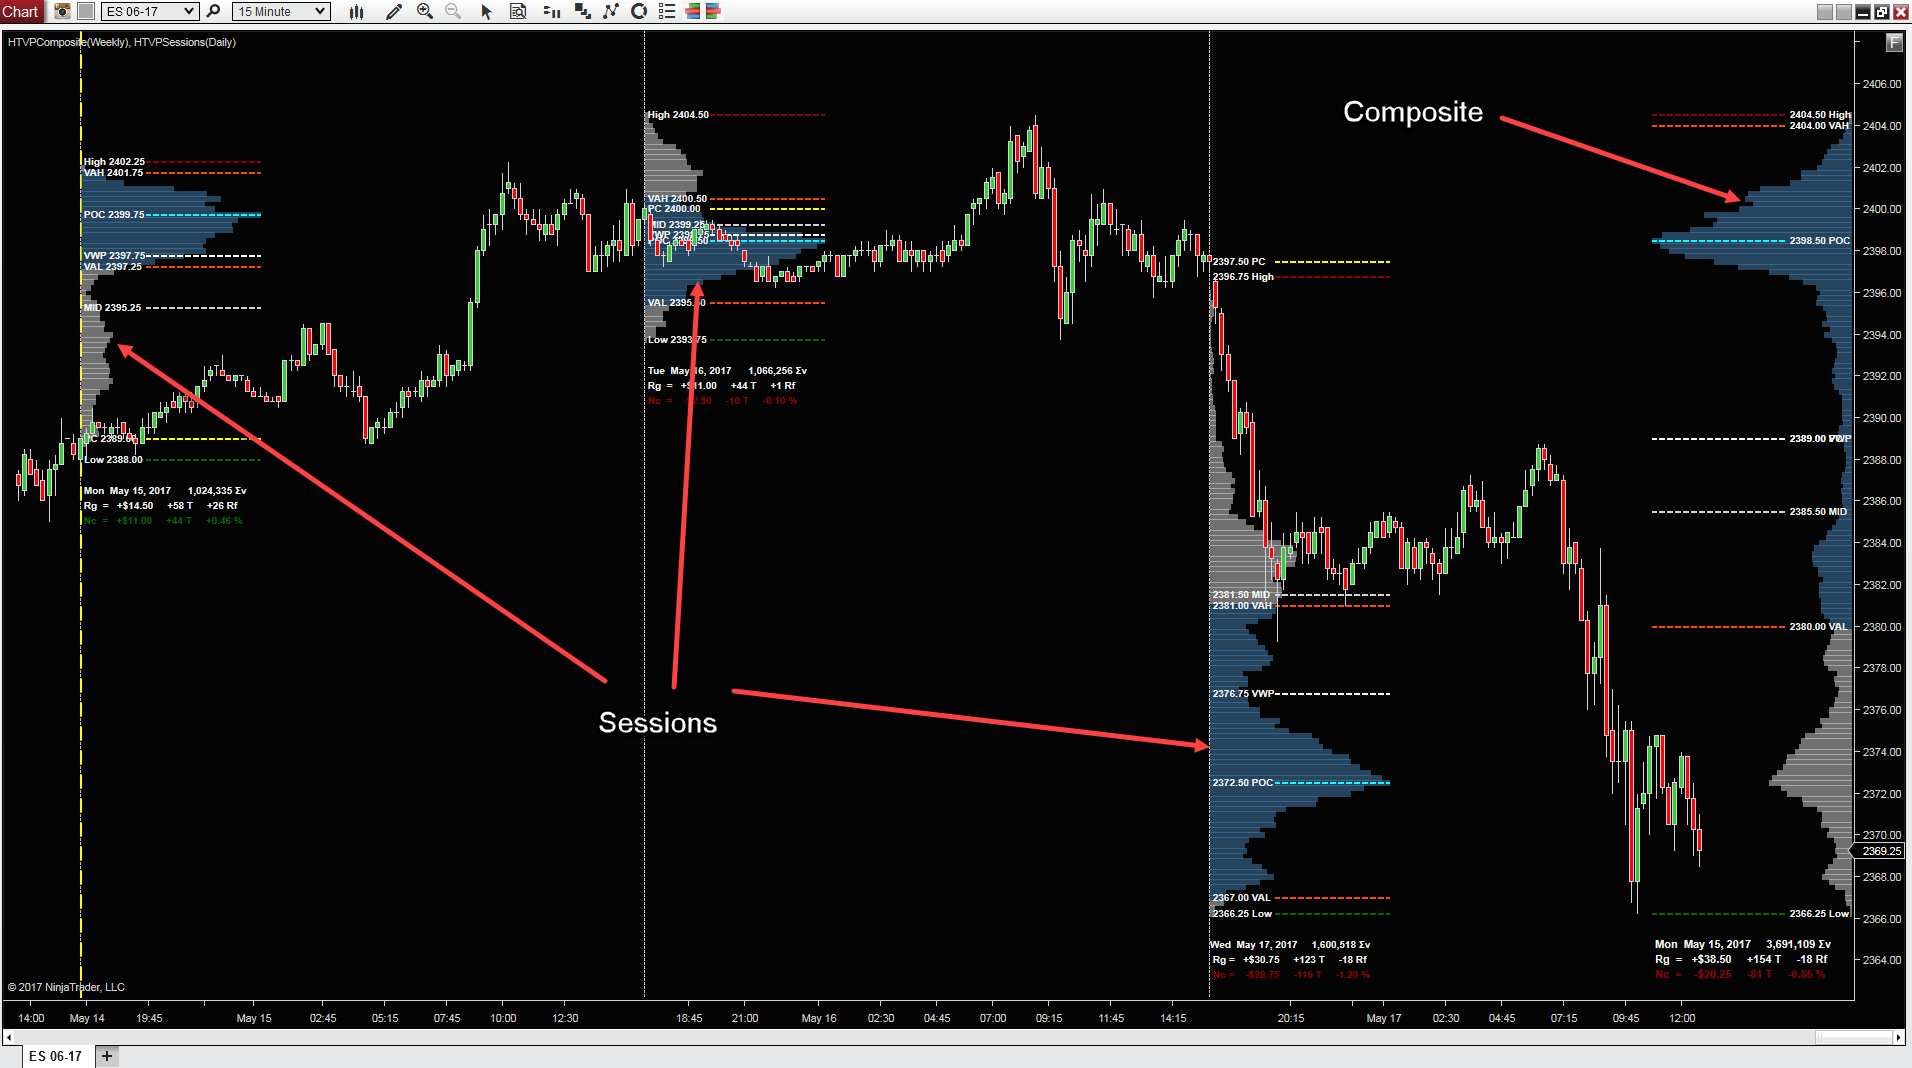
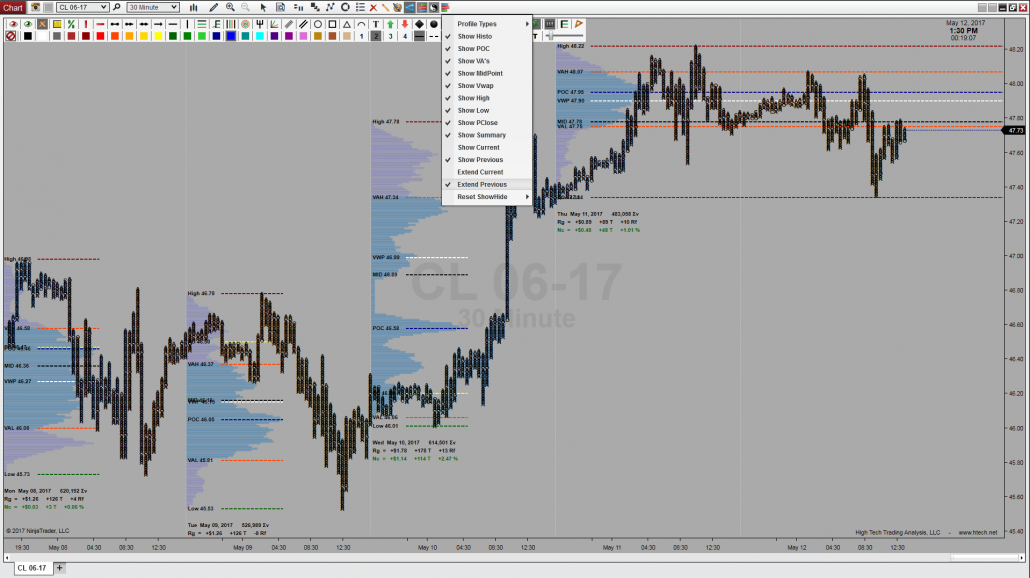
Volume Profile is an advanced charting technique that displays trading activity (Volume), accumulated over a specified time period, at specified price levels. This technique plots a histogram on the chart meant to reveal dominant and/or significant price levels based on Volume at Price over a specified period of Time. Essentially, Volume Profile compares and calculates the total volume traded at a specific price level during the specified time period, to the total overall volume for that same period. Then represents and displays this information as a vertical histogram making it easily visible to the trader.
2 Distinct Composite Profile Types:
- Time (TPO)
- Volume (VPO)
5 User Configurable Session Period/Duration Types:
- Daily
- Weekly
- Monthly
- Yearly
- Contract
Configuration Settings allow for a multitude of choices and ways to view Session Profiles of Unique Revolving Durations.
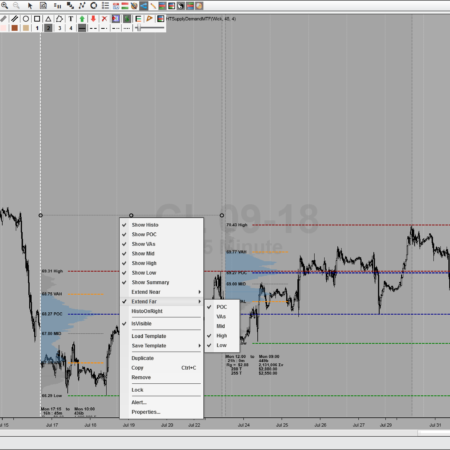
Calculated and Displayed Levels of Significance:
Value Area (VA) – The range of price levels in which a specified percentage of all volume was traded during the time period.
Value Area High (VAH) – The highest price level within the value area.
Value Area Low (VAL) – The lowest price level within the value area.
Point of Control (POC) – The price level for the time period with the highest traded volume.
Volume Weighted Avg Price (VWAP) – The price level the avg weighted volume traded during the specified time period.
Previous Close (PC) – Last Closing Price Before Volume Profile Start DateTime.
Profile High (HIGH) – The highest reached price level during the specified time period.
Profile Low (LOW) – The lowest reached price level during the specified time period.
Profile MidPoint (MID) – The midpoint reached price level during the specified time period.
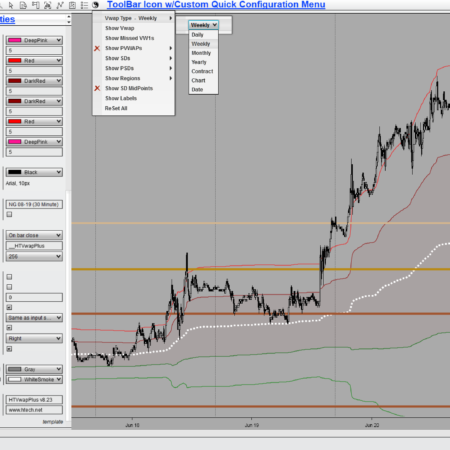
Session Profile Indicator Properties Settings
Profile Type – Volume(VPO) or Time(TPO)(Beta)
Profile Duration – Choose Session Profiles Between Days, Weeks, Months, Contracts, or Years!
Value Area Percent – User Configurable from 0 to 100 percent. (Default 70%)
Histo Placement – User Configurable to Display on the Left or Right Hand Side of Session.
Histo Width – User Configurable in static pixels (and soon to come Percentage of Chart Width)
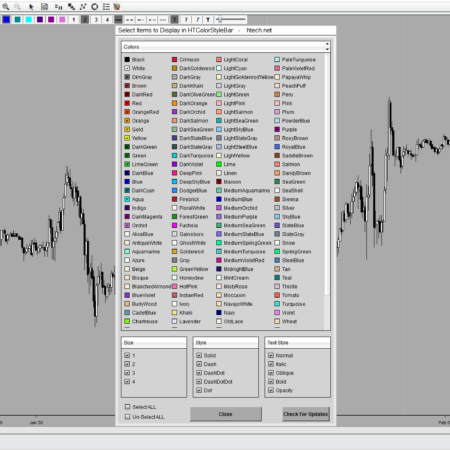
Histo Color – User Configurable to any Color and any Opacity
Histo VA Color – User Configurable to any Color and any Opacity
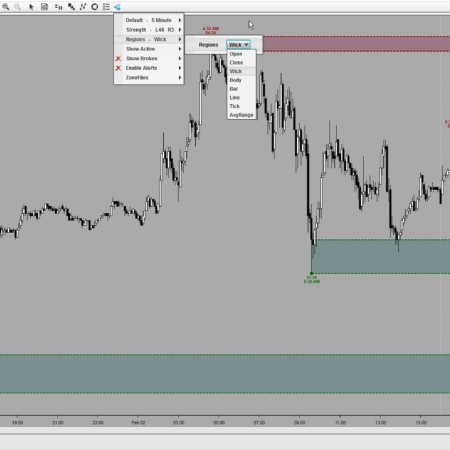
Levels All – Independent user Configurable Colors, Style, and Widths
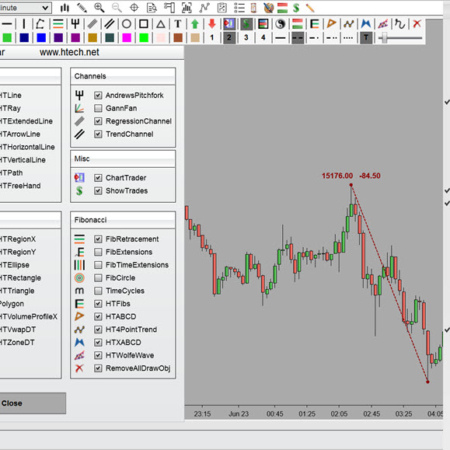
Session Profile ToolBar Icon DropDown Menu Settings
Access DropDown Menu with a Single Click for Quick and Easy User Configuration
Change Profile Session Duration with a couple simple clicks
Histo – User Configurable to Display on the Left or Right Hand Side of Each Session.
Histo – Hide or Show Profile Histogram with Simple Click
Levels All – Independently Hide or Show any Level and/or Histogram
Levels ALL – Levels can be extended across the entire Session.
Levels Current – Levels can be extended across the entire chart area.
Levels Last – Levels can be extended across the entire chart area.
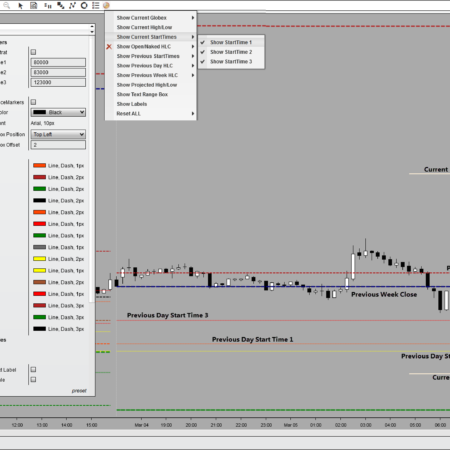
Additional Summary Information Displayed:
Profile DateTime Start
Total Volume
Total Delta
Rotational Factor
Total Range in $$, Ticks
Current Net Change in $$, Ticks, and Percentage
ALL Plots Can be Quickly Hidden (INDIVIDUALLY and/or Altogether)
with a Single Click of the Mouse (thru dropDown Icon placed in NT’s ToolBar)
– ALL Plot Colors and Styles are Completely User Configurable!
– ToolBar DropDown Icon for Easy User Selectable Options and Adjustments Without Chart Refresh.
Volume Profile is an extremely valuable and versatile technical analysis tool that is used by trader’s all over the world. There are Numerous trading strategies out there using Volume Profile as a key component. One thing that many traders will use volume profile for is identifying basic support and resistance levels. To do this, the trader relies on, and analyses, past price movements and volume behavior. This type of methodology can be useful in assisting the trader to apply meaning or significance to price levels where the market has already visited. Below are just a few more basic examples of how a trader might utilize volume profile techniques..
– If the current day opens above the previous day’s value area (but still below the Previous Day’s Profile High) look for price to retrace back towards the Previous Days Point of Control and then proceed to rise again in the original direction of the current day’s open.
– If the current day opens below the previous day’s value area (but still above the Previous Day’s Profile Low) look for price to retrace back towards the Previous Days Point of Control and then proceed to fall again in the original direction of the current day’s open.
– If the current day’s opening price is completely outside of the previous day’s profile (above the Previous Profile High or below the Previous Profile Low) this can be seen as a possible strong trend and/or runner in the direction of the current opening price relative to the previous day’s profile range.
The key to Volume Profile’s continued relevancy is its versatility. It is an advanced charting tool that truly does have a wide array of uses. Unlike many other techniques, there is little to no debate about Volume Profile’s usefulness. The data that is provided by Volume Profile is indisputable, leaving it to the trader to find new and creative ways to use it.