
-
Auto Tab | NT8 | Subscription
$49.99 / monthAuto Tab Automatically adds a “Tab Link Selector” to Every Chart Window (similar to the default Instrument and Interval Links). Change or Select the Tab of Any One Window, and All Other Windows (set to same Linked Color) will Change to that Same Tab.
This can now greatly reduce the real estate required for organizing and viewing your charts. Possibly, eliminate the need for multiple workspaces all together. AutoTab is extremely easy to use, will save you a ton of time, and will provide you the ultimate in convenience.
Built in Configurable Timer to Enable Auto Timed Tab Sequencing!
Features: (Click Image for a Detailed Description and Full List of Features)
– Automatically Adds a Tab Link Color Selector to Every NinjaTrader 8 Chart Window
– Automatically Switch Any/All Chart Window Tab(s) to that of Another with a Single Click
– Extremely Convenient and Easy User Selectable Configurations, Options, and Adjustments.
– 11 Unique Tab Color Options for Configuring Exactly what (if any) Chart Windows are Linked
– 1 Unique Tab Color Option to Link Any Chart Window’s Tabs to Any/All Chart Windows
– 1 Unique Tab Color Option to leave Linking Off for Any/All Chart WindowsA MUST for any Trader Concerned or Limited in Monitor Real Estate!
-
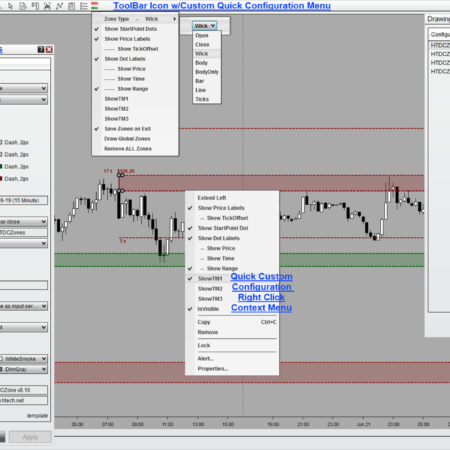
Double Click Zones | NT8 | Subscription
$49.99 / monthManually Creating Levels of Interest Couldn’t Get Easier!
“Double Click Anywhere on Chart to Automatically Display!”
Select from 8 Unique Zone/Level/Region Size Types!
•Open •Close •Body •Bar •Wick •Line •Specified Ticks •Avg Range* Works with “ANY” default Bar, Data Series, Chart Type! *
Multiple Unique and/or User Configurable Features:
• Custom Right Click Context Menu Single Click Modifications
• Insert New Zones/Levels Any Where on your Chart!
• Remove/Delete “Any” Existing Zone/Level/Region!
• Modify, Move, and/or Remove Any Zone/Level on the Chart.
• Automatically Save your Zones on Exit! (Optional Yes/No)* Ability to Set “ANY” Zone/Level/Region as Global! *
* Independent and Unique Color Options for:
– Normal/Global and Upper/Lower Zones
* Independent and Unique Template Options for:
– Normal/Global and Upper/Lower Zones* Global/Normal Zones Settings are Completely Independent(Click Image for Detailed Description and Features!)
ToolBar DropDown Icon for Simple & Easy Configurations!
-
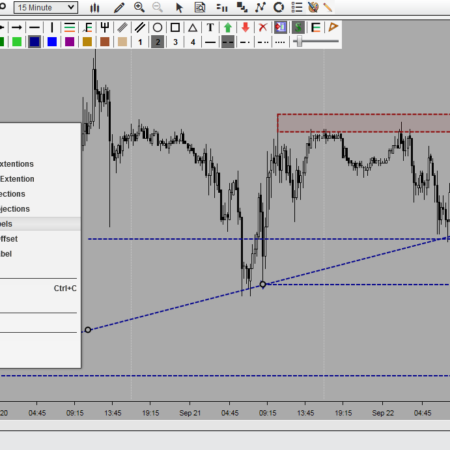
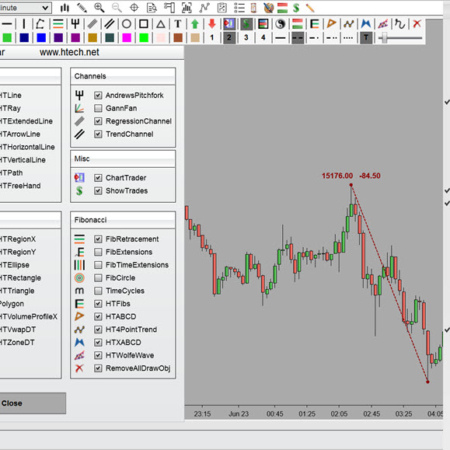
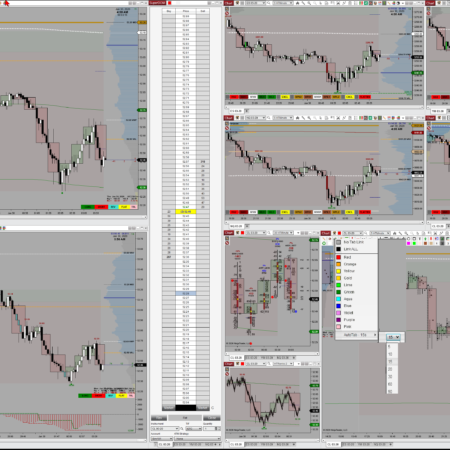
DrawBar Ultimate | NT8 | Subscription
$49.99 / monthDrawBar Ultimate – Customizable Drawing, Color and Stylizing ToolBars. 12 Custom Drawing Tools w/Unique Properties/Rendering and Enhanced Right Click Context Menus. Draw, Show, Hide, Color, Style, Modify Any Manually Drawn Object w/Couple Clicks. Extremely Configurable! Extensive Options!
Specifically designed for the ease and convenience of drawing on your charts. Draw, Show, Hide, and Modify Color and Styles of Any manually drawn object with a single click. Perfect for both the novice and/or expert trader. Extremely easy to use, saves time, and provides the ultimate in convenience and technical analysis! There is currently no other tool like it for NinjaTrader 8 in the market place today!
12 Custom Drawing Tools | Unique Right Click Context Menus | Quick and Easy Property Changes!
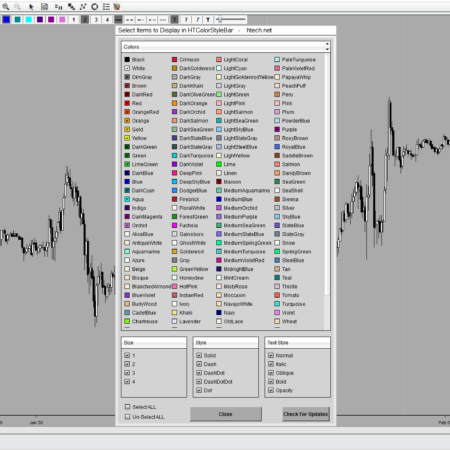
Also Includes: NinjaTrader8 Color/Style Bar
Features: (Click Image for a Detailed Description and Full List of Features)
– Add a Customizable Drawing ToolBar to Any/All NinjaTrader 8 Charts.
– Draw, Show, and/or Hide any Manually Drawn Object with a Single Click
– Single Click Pop-Up Window for Easy User Selectable Options and Adjustments.
– Individually Select the Draw Object Icons You’d Like to Display in Toolbar
– Selectable Mounting to the Top or Left Hand Side of your Chart (coming soon)
– Show/Hide the Entire Drawing ToolBar with a Single Middle Click
– Show/Hide Chart Trader Button
– Show/Hide Trade Executions ButtonA Must for Any Serious Trader that Draws on their Charts!
-
Magic Menu | NT8 | Subscription
$49.99 / monthIdentifies All Indicators (Default or Custom) Applied to Any Chart!
Hide/Show Any/All of Your Applied Indicator’s:
* Plots
* DrawObjects
* VisibilityControl Most Aspects of All Applied Indicators thru Simple ToolBar DropDown Icon!
Please Click Product Image for Detailed List of Features and Limitations:
-
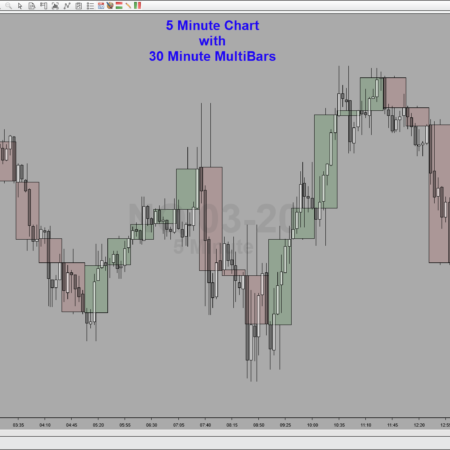
MultiBars Plus | NT8 | Subscription
$49.99 / monthDynamically Track, Overlay, and Display Multiple Dataseries on the Same Chart..
Add, Overlay, and Display any Minute Based Bars onto almost any other chart you want.. It’s Simple!.. Just add MultiBars to your chart.. Choose the number of minutes you’d like for your Overlay Bars.. and Wallah.. MultiBars Automatically Displays this for you, and Always in both a Logical and very aesthetically pleasing way!
Select from 2 Unique Modes of Operation! Minute Mode: | Bar Mode:
Just Choose how many minutes/bars you’d like overlay’d bars to be:
and MultiBars will Add, Overlay, and Always Display them Logically!
(Minute Mode Require Intraday Primary Chart Data!)** Dynamically Displays In Bar Progress while doing Historical Analysis! **
* Independent Color and Transparency Settings for Unlimited Choices!
* Remove the Clutter and Cumbersomeness of using of Multiple Charts!*** Works with “Most” default Bar, Data Series, or Chart Type! ***
-
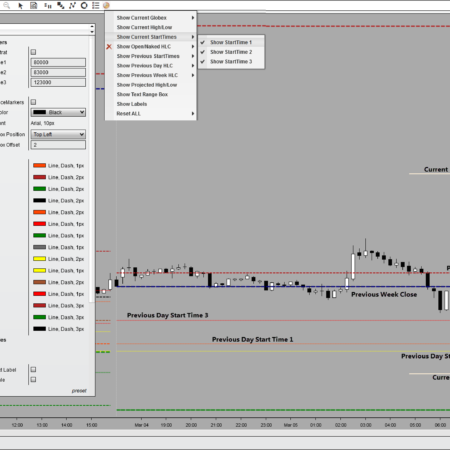
Price Times Plus | NT8 | Subscription
$49.99 / monthDisplays 24 Current/Previous/Projected OHLCR Levels of Significance..
Levels of Significance that Every Trader Should Be Aware Of!
Display them ALL from one Nicely put together package..(7) Current Daily Values:
(7) Previous Daily Values:
(3) Previous Weeks Values:
(2) Projected Daily Values:
(5) Range TextBox Displays:Pick ANY 3 Unique Times Down to the Minute
•Missed/Naked Previous Highs/Lows (coming soon)
– ALL Plots Can be Quickly Hidden (ALL or INDIVIDUALLY)
– ALL Plot Colors and Styles are Completely Configurable!
– ToolBar DropDown Icon for Simple and Easy User Selectable Options and Adjustments Without Chart Refresh.(Click Image for Detailed Description and Features!)
Quit Using Indicators that display different values on every chart your looking at!
-
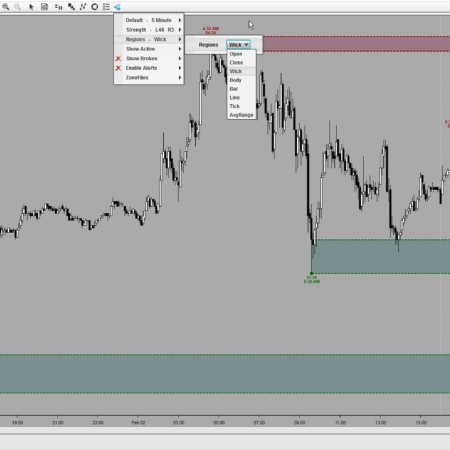
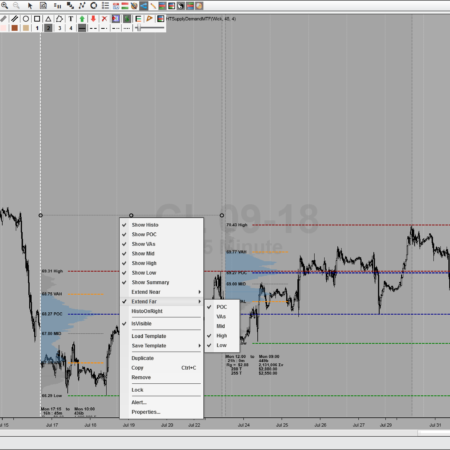
Supply & Demand (MTF) | NT8 | Subscription
$49.99 / monthSupply and Demand (MTF) Automatically Displays Areas of Support and Resistance, while Assisting to Identify Market Rotation and Cycles, Trends, Swings, Turning Points, Break Outs, and Specific Areas of Interest. Merge, Modify, Move, Insert, Remove, Save, Load, Hide/Show Any Zone/Levels.
Display Supply and Demand Zones/Levels/Regions of any Data Series, on Any Chart!
•Minute •Second •Tick •Volume •Range •Renko •Daily •Weekly •Monthly •YearlySelect from 8 Unique Zone/Level/Region Size Types!
•Open •Close •Body •Bar •Wick •Line •Specified Ticks •Avg Range***** Now with the Ability to both Save and Load Your Own Customized Zone Templates *****
• Merge Any Zone/Level with the next/previous Zone/Level
• Modify, Move, and/or Remove Any Zone/Level on the Chart
• Insert New Zones/Levels Above or Below any Existing Zone/LevelFeatures: (Click Image for a Detailed Description and Full List of Features)
• Change/Set Zone/Level Data Series and Period Value (requires refresh)
• Change/Set Individual Look Back and Forward Strengths (requires refresh)
• Change/Set Zone/Level Size Type (requires refresh)
• Hide/Show All Zones/Levels with a Single Click
• Hide/Show Both Active and/or Broken Zones/Levels
• Hide/Show Price Labels for Zones/Levels/Dots
• Hide/Show Tick Offset Labels from Current Price
• Turn On/Off Adjustable Zone/Level Break Alert
• Turn On/Off Adjustable Zone/Level Create Alert
• Save, Manage, Load Zone Templates (loading requires refresh)ToolBar DropDown Icon for Easy User Selectable Options and Adjustments!
-
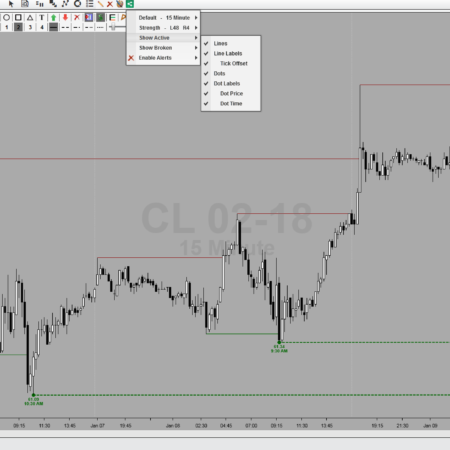
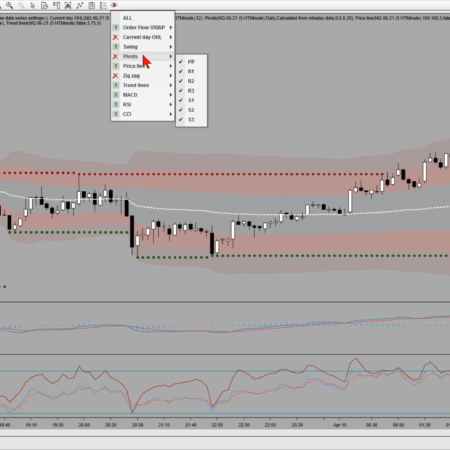
Swings (MTF) | NT8 | Subscription
$49.99 / monthSee Swings for Any Default Data Series you’d Like!
•Watch 60 min swings on a 5 min chart:
•Watch 5000 volume swings on a 500 volume chart:
•Watch 610 tick swings on a 144 tick chart:“OR” You Can Even Mix and Match Data Series:
•Watch 15 min swings on a 610 tick chart:
•Watch Volume on Tick, Tick on Volume, Min on Range, etc:
•Works across any default Data Series: (including most custom)– Calculates and Draws Swing High/Low’s
– Individually Adjustable Look Back/Forward Strengths
– Hide or Show Indicator with a Single Click
– Hide or Show Active and/or Broken Swings
– Hide or Show Price Labels for Swings or Dots
– Hide or Show Tick Offset Labels from Current Price
– Move or Remove Any Swing on the Chart
– Turn On/Off Adjustable AlertsToolBar DropDown Icon for Simple & Easy Configurations!
-
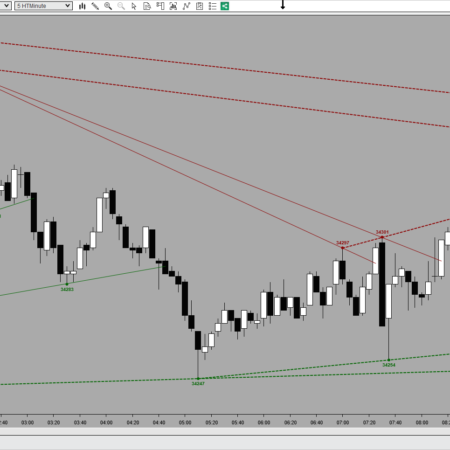
Trends (MTF) | NT8 | Subscription
$49.99 / monthSwing Trends Multi-TimeFrame | Support – Resistance | Technical Analysis
Takes Swing Multi-TimeFrame one step further by calculating and displaying Trends
See Swings and/or Trends for Any Default Data Series you’d Like!
- Watch 60 min swings/trends on a 5 min chart:
- Watch 5000 volume swings/trends on a 500 volume chart:
- Watch 610 tick swings/trends on a 144 tick chart:
“OR” You Can Even Mix and Match Data Series:
- Watch 15 min trends on a 610 tick chart:
- Watch Volume on Tick, Tick on Volume, Min on Range, etc:
- Works across any Data Series: (with the exception of custom bar types)
ToolBar DropDown Icon for Simple & Easy User Configurations!
– Calculates and Draws Swings and/or Trend High/Low’s
– Individually Adjustable Look Back/Forward Strengths
– Hide or Show Indicator with a Single Click
– Hide or Show Active and/or Broken Trends
– Hide or Show Price Labels for Trends or Dots
– Hide or Show Tick Offset Labels from Current Price
– Turn On/Off Adjustable Alerts -
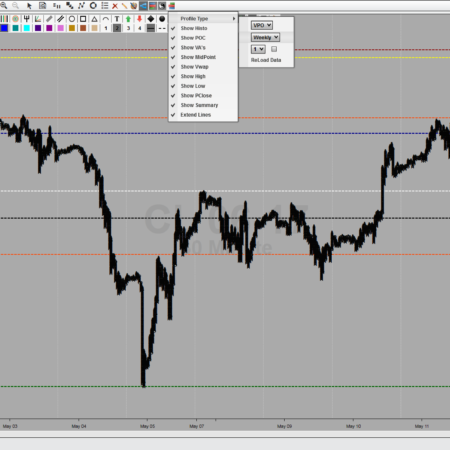
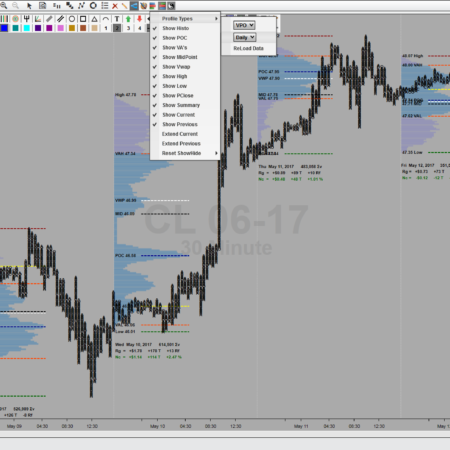
Volume Profile Composite | NT8 | Subscription
$49.99 / monthVolume Profile (VP) is an advanced charting technique that Displays Trading Activity (Volume), accumulated over Time (a specified period of time), at every tradable Price (between the time period’s High/Low). This technique plots a histogram on the chart meant to reveal dominant and/or significant price levels based on Volume at Price over Time. Both High and Low Volume Nodes (Price Levels) become easily visible to the trader.
2 Distinct Profile Types | 7 Configurable Composite Types | A Multitude of Enhanced Features!
Configuration Settings allow for a multitude of choices and ways to view Profiles of Unique Revolving Durations, or from a Specified Start Date, or even View a Profile Specified Between Any 2 Dates.
Levels of Significance: (Click Image for a Detailed Description and Full List of Features)
– Value Area (VA) – Specified percentage of all volume traded during Specified Time Period.
– Value Area High (VAH) – The Highest Price level within the Value Area.
– Value Area Low (VAL) – The Lowest Price level within the Value Area.
– Point of Control (POC) – The Price level for the time period with the Highest Traded Volume.
– Volume Weighted Avg Price (VWAP) – Volume Weighted Average Price of Specified Time Period.
– Previous Close (PC) – Last Closing Price Before Volume Profile Start DateTime.
– Profile High (HIGH) – The Highest reached Price level during the Specified Time Period.
– Profile Low (LOW) – The Lowest reached Price level during the Specified Time Period.
– Profile MidPoint (MID) – The Midpoint reached Price level during the Specified Time Period.
– Additional Summary Information of Profile!ToolBar DropDown Icon for Easy User Selectable Options and Adjustments!
-
Volume Profile Dynamic | NT8 | Subscription
$49.99 / monthVolume Profile is an advanced charting technique that displays trading activity (Volume), accumulated over a specified time period, at specified price levels. This technique plots a histogram on the chart meant to reveal dominant and/or significant price levels based on Volume at Price over a specified period of Time. Essentially, Volume Profile compares and calculates the total volume traded at a specific price level during the specified time period, to the total overall volume for that same period. Then represents and displays this information as a vertical histogram making it easily visible to the trader.
“Dynamically Draw Volume Profiles” | AnyWhere on Chart!
Levels of Significance: (Click Image for Detailed Features!)
– Value Area (VA) – Specified percentage of all volume
– Value Area High (VAH) – Highest Price level of Value Area
– Value Area Low (VAL) – Lowest Price level of Value Area
– Point of Control (POC) – Highest Traded Volume Price level
– Volume Weighted Avg Price (VWAP) – VWAP of Profile
– Previous Close (PC) – Last Closing Price Before Profile Start
– Profile High (HIGH) – Highest reached Price level of Profile
– Profile Low (LOW) – Lowest reached Price level of Profile
– Profile MidPoint (MID) – Midpoint Price level of Profile
– Additional Summary Information of Profile!ToolBar DropDown Icon for Simple & Easy Configurations!
-
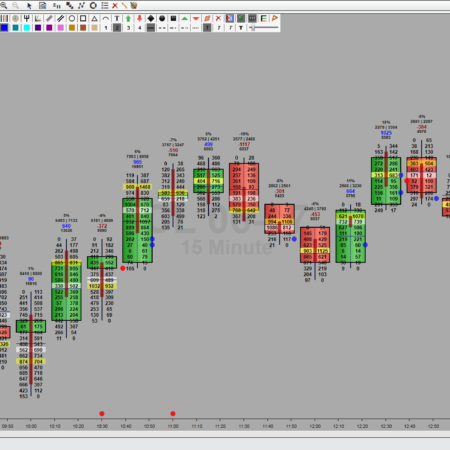
Volume Profile OrderFlow | NT8 | Subscription
$49.99 / monthHTOrderFlow was designed with many enhanced features in order to help reveal a unique perspective of Significant Price Levels within Each Bar (POC, Value Area, Vwap, MidPoint), Price and Bar Volume, Delta, and even Buy/Sell Imbalances. This approach offers exceptionally detailed information, and greatly assists any trader to “See What is Really Going on inside each and every bar, at every price level!”
“What’s Really Going on Inside Every Bar at Every Price Level!”
Levels of Significance (Each Bar) (Click Image for Details)
• Buy and Sell Volume or Delta Volume – at Price
• Value Area (VA) – Specified Percentage of all volume traded
• Point of Control (POC) – Highest Traded Volume Price Level
• Volume Weighted Avg Price (VWAP) – Bar Vwap Price Level
• Profile MidPoint (MID) – Midpoint Price Level of Bar
• Buy and Sell Imbalances (Bar/Price) (Diagonal/Horizontal)Dual Programmable Buy vs. Sell Imbalance Visual Alerts
• Diagonal Buy/Sell Imbalance – Independent Ratio Multiples
• Horizontal Buy and Sell Imbalance – Independent Ratios
Display Either, Both, or even Combination of ImbalancesAdditional Summary Information Displayed Over Each Bar
• Total Volume of Bar
• Total Buys and Total Sells of Bar
• Total Delta Volume – Total Buy minus Total Sell Volume
• Total Delta Percentage – Delta Volume / Total VolumeToolBar DropDown Icon for Simple and Easy Configuration!
-
Volume Profile Sessions | NT8 | Subscription
$49.99 / monthVolume Profile (VP) is an advanced charting technique that Displays Trading Activity (Volume), accumulated over Time (a specified period of time), at every tradable Price (between the time period’s High/Low). This technique plots a histogram on the chart meant to reveal dominant and/or significant price levels based on Volume at Price over Time. Both High and Low Volume Nodes (Price Levels) become easily visible to the trader.
2 Distinct Profile Types | 5 Configurable Session Types | A Multitude of Enhanced Features!
Levels of Significance: (Click Image for a Detailed Description and Full List of Features)
– Value Area (VA) – Specified percentage of all volume traded during Specified Time Period.
– Value Area High (VAH) – The Highest Price level within the Value Area.
– Value Area Low (VAL) – The Lowest Price level within the Value Area.
– Point of Control (POC) – The Price level for the time period with the Highest Traded Volume.
– Volume Weighted Avg Price (VWAP) – Volume Weighted Average Price of Specified Time Period.
– Previous Close (PC) – Last Closing Price Before Volume Profile Start DateTime.
– Profile High (HIGH) – The Highest reached Price level during the Specified Time Period.
– Profile Low (LOW) – The Lowest reached Price level during the Specified Time Period.
– Profile MidPoint (MID) – The Midpoint reached Price level during the Specified Time Period.
– Additional Summary Information of Profile!ToolBar DropDown Icon for Easy User Selectable Options and Adjustments!
-
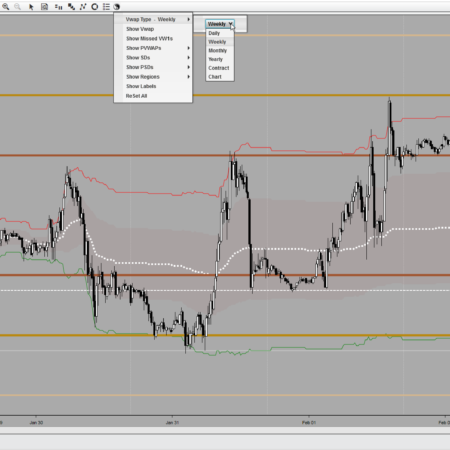
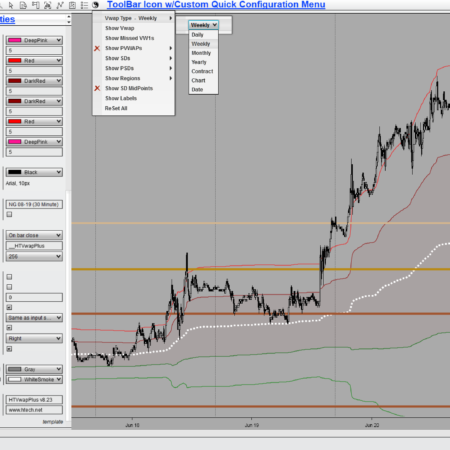
Vwap Plus | NT8 | Subscription
$49.99 / monthVolume-Weighted Average Price (VWAP) is the ratio of volume traded at price, to the total volume traded, over a particular time horizon. VWAP is often used as a trading benchmark by investors who aim to be as passive as possible in their execution. The aim of using a VWAP is to ensure that the trader executing the order does so in-line with volume on the market.
7 User Configurable VWAP Session Period Types:
• Daily • Weekly • Monthly • Yearly • Contract • Chart • User Defined Date17 Unique Current and Previous Session Value Plots
Current Session Developing Plots:
• Volume Weighted Average Price (VWAP)
• 3 Unique Upper and Lower Standard Deviations of VWAPPrevious Session Plots:
• 1 Session Prior Volume Weighted Average Price (VWAP1)
• 3 Unique Upper and Lower Standard Deviations of Previous VWAP1
• 2 Session Prior Volume Weighted Average Price (VWAP2)
• 3 Session Prior Volume Weighted Average Price (VWAP3)ToolBar DropDown Icon for Easy User Selectable Options and Adjustments!
VWAP Values/Plots Remain Consistent (Are the Exact Same) Across Every DataSeries!
Accurately Display and Trade Off of The Exact Same Values On All Your Charts!
NinjaTrader 8 Subscription
Recent Reviews
-
Price Times Plus | NT8
Rated 5 out of 5by Jimmy
-
 DrawBar Ultimate | NT8
Rated 5 out of 5by Tammo Eckert
DrawBar Ultimate | NT8
Rated 5 out of 5by Tammo Eckert -
Supply & Demand (MTF) | NT8
Rated 5 out of 5by Anthony Wood
-
 Color Style ToolBar | NT8
Rated 5 out of 5by Alex Koe
Color Style ToolBar | NT8
Rated 5 out of 5by Alex Koe -
 Auto Tab Linking | NT8
Rated 5 out of 5by Alex Koe
Auto Tab Linking | NT8
Rated 5 out of 5by Alex Koe -
Auto Tab Linking | NT8
Rated 5 out of 5by Randy Campbell
-
 Vwap Plus | NT8
Rated 5 out of 5by Derek Richards
Vwap Plus | NT8
Rated 5 out of 5by Derek Richards
Product Reviews
- This is the best product for determining daily/weekly/monthly...March 13, 2026 by Jimmy
- Great drawing tool. Working with it makes my life easier...August 4, 2025 by Tammo Eckert
- I have been a customer for several years now and the support...June 26, 2025 by Anthony Wood
- I have tried almost all of the drawing tools out that in...June 1, 2025 by Alex Koe
- For someone that trades multiple commodities at once, the...June 1, 2025 by Alex Koe
- Auto Tab makes following multiple futures symbols in different...January 28, 2025 by Randy Campbell
- I'd echo these 5star reviews. I've tried maybe a half dozen...October 19, 2024 by Derek Richards
Best Sellers
-
 Supply & Demand (MTF) | NT8
Rated 5.00 out of 5
Supply & Demand (MTF) | NT8
Rated 5.00 out of 5$399.99Original price was: $399.99.$299.99Current price is: $299.99. -
 Auto Tab Linking | NT8
Rated 5.00 out of 5
Auto Tab Linking | NT8
Rated 5.00 out of 5$199.99Original price was: $199.99.$149.99Current price is: $149.99. -
 Volume Profile Sessions | NT8
Rated 5.00 out of 5
Volume Profile Sessions | NT8
Rated 5.00 out of 5$199.99Original price was: $199.99.$149.99Current price is: $149.99. -
 DrawBar Ultimate | NT8
Rated 4.94 out of 5
DrawBar Ultimate | NT8
Rated 4.94 out of 5$399.99Original price was: $399.99.$299.99Current price is: $299.99. -
 Vwap Plus | NT8
Rated 5.00 out of 5
Vwap Plus | NT8
Rated 5.00 out of 5$199.99Original price was: $199.99.$149.99Current price is: $149.99. -
 Double Click Zones | NT8
Rated 5.00 out of 5
Double Click Zones | NT8
Rated 5.00 out of 5$299.99Original price was: $299.99.$199.99Current price is: $199.99. -
 Volume Profile Composite | NT8
Rated 5.00 out of 5
Volume Profile Composite | NT8
Rated 5.00 out of 5$199.99Original price was: $199.99.$149.99Current price is: $149.99.
| M | T | W | T | F | S | S |
|---|---|---|---|---|---|---|
| 1 | 2 | 3 | ||||
| 4 | 5 | 6 | 7 | 8 | 9 | 10 |
| 11 | 12 | 13 | 14 | 15 | 16 | 17 |
| 18 | 19 | 20 | 21 | 22 | 23 | 24 |
| 25 | 26 | 27 | 28 | 29 | 30 | 31 |