Product Description
Free Trials involve an incredible amount of time and support! Regretfully, spare time seems to be an extremely scares commodity!! As an Alternative, I’m offering this monthly subscription service as a Low Risk Means to Test For Yourself, before you Purchase!!!
Any Time in the First 30 Days!!
“You Like What You See”!!!!
“Would Like to Purchase”!!!
Your Initial Subscription Fee Will Be Discounted from the price of the Product being Purchased!!!
If at Any Time, for Whatever Reason.. You’d rather not continue or purchase at that time.. No Worries at All.. Just cancel the subscription, uninstall the product when it expires, and all your out is a small nominal fee to help cover my time and support.
I believe this to be a fair compromise.. I don’t end up wasting my time with thousands of people just searching for the next Freebies, and You’ll Never Spend a lot of money (not that my products are expensive) on something you might end up not wanting after all..
——————————————————————————————————————————————————–
PriceTimes Plus | Open-High-Low-Close-Range | Support – Resistance
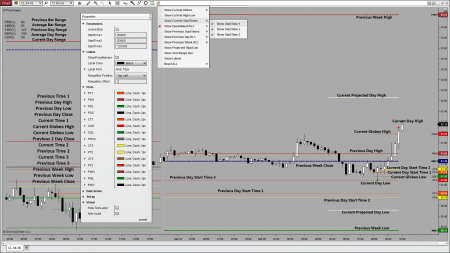
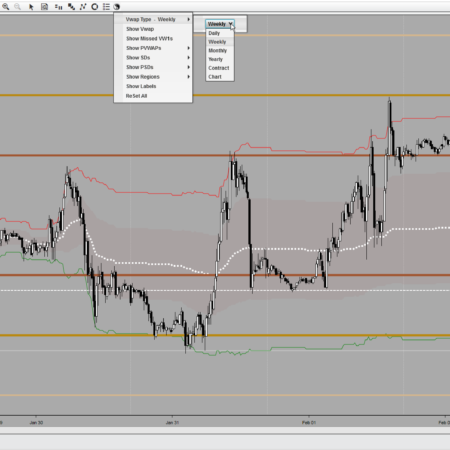
“Displays 24 Current/Previous/Projected OHLCR Levels of Significance!”*
Specific Levels of Significance that Every Trader Should Be Aware Of!
Price Times Plus Displays them ALL from one Nicely put together package..
Current Daily Values:
• Current Daily High
• Current Daily Low
• Current Daily Globex High
• Current Daily Globex Low
• Current Daily Start Time 1
• Current Daily Start Time 2
• Current Daily Start Time 3
Previous Daily Values:
• Previous Daily High
• Previous Daily Low
• Previous Daily Close
• Previous 2 Day Close
• Previous Daily Start Time 1
• Previous Daily Start Time 2
• Previous Daily Start Time 3
Previous Weeks Values:
• Previous Weekly High
• Previous Weekly Low
• Previous Weekly Close
Projected Daily Values:
• Projected Daily High
• Projected Daily Low
Range TextBox Display:
• Previous Bar Range
• Average Bar Range
• Previous Daily Range
• Average Daily Range
• Current Daily Range
Pick ANY 3 Unique Times Down to the Minute
Example of Start Times:
8:00am Crude Open = Start Time 1
8:30am Equities Open = Start Time 2
10:30am Euro Close = Start Time 3
•Missed/Naked Previous High/Low/Close (coming soon)
– ALL Plots Can be Quickly Hidden (INDIVIDUALLY and/or Altogether)
– ALL Plot Colors and Styles are Completely User Configurable!
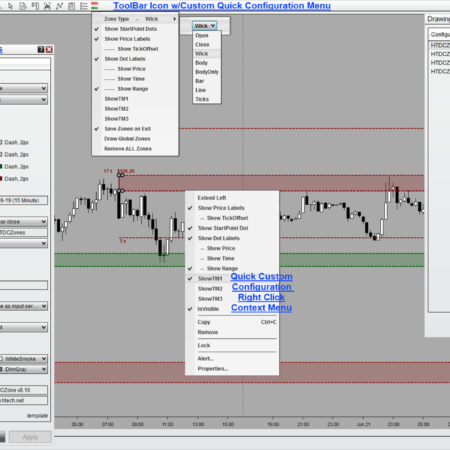
– ToolBar DropDown Icon for Simple & Easy User Selectable Options, Adjustments, and Configurations!.
Quit Using Indicators that display different values on every chart!

