Product Description
Free Trials involve an incredible amount of time and support! Regretfully, spare time seems to be an extremely scares commodity!! As an Alternative, I’m offering this monthly subscription service as a Low Risk Means to Test For Yourself, before you Purchase!!!
Any Time in the First 30 Days!!
“You Like What You See”!!!!
“Would Like to Purchase”!!!
Your Initial Subscription Fee Will Be Discounted from the price of the Product being Purchased!!!
If at Any Time, for Whatever Reason.. You’d rather not continue or purchase at that time.. No Worries at All.. Just cancel the subscription, uninstall the product when it expires, and all your out is a small nominal fee to help cover my time and support.
I believe this to be a fair compromise.. I don’t end up wasting my time with thousands of people just searching for the next Freebies, and You’ll Never Spend a lot of money (not that my products are expensive) on something you might end up not wanting after all..
——————————————————————————————————————————————————–
Supply Demand | Multi-TimeFrame | Swings | Support – Resistance | Technical Analysis | NinjaTrader 8 | Indicator
Designed for analyzing the financial markets with both the novice and expert trader in mind. Automatically displays areas of support and resistance, and assists in identifying market rotation and cycles, trends, supply and demand, swings, turning points, break outs, and determining specific areas of interest. Enhanced capabilities save time, and are extremely convenient.
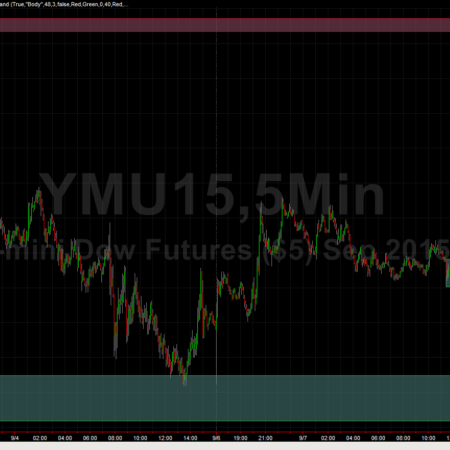
A Supply/Demand level is a level where the price tends to find support as it rises/falls. This means the price is more likely to “bounce” off this level rather than break through it. However, once the price has breached this level, by an amount exceeding some noise, it is likely to continue rising or falling until meeting another supply/demand level.
Show Supply and Demand Zones/Levels/Regions of any Data Series you want, on Any Chart you’d Like!
- Minute
- Second
- Tick
- Volume
- Range
- Renko
- Daily
- Weekly
- Monthly
- Yearly
Mix and Match Any Data Series, with Individually Adjustable Look Back and Forward Strengths!
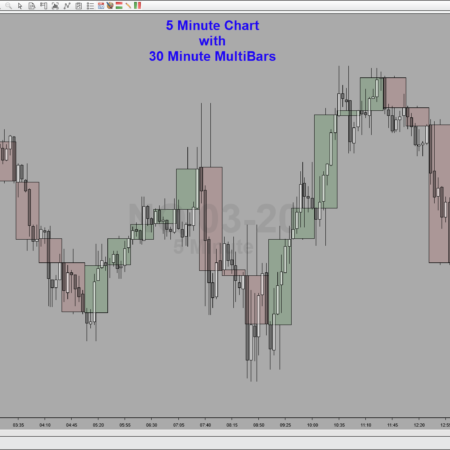
- Display 60 min SDs on a 5 min chart:
- Display 5000 volume SDs on a 500 volume chart:
- Display 610 tick SDs on a 144 tick chart:
- Display 15 min SDs on a 610 tick chart:
- Display Volume on Tick, Tick on Range, Min on etc:
- Display Zones of Any NT Default Data Series:
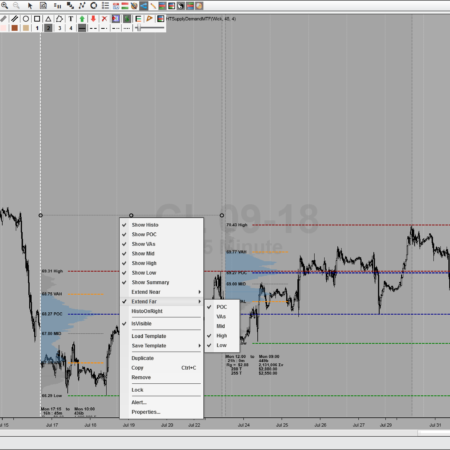
***** Now with the Ability to both Save and Load Your Own Customized Zone Templates *****
- Merge Any Zone/Level with the next/previous Zone/Level
- Modify, Move, and/or Remove Any Zone/Level on the Chart
- Insert New Zones/Levels Above or Below any Existing Zone/Level
When you have all your zones just the way you want them. Save your Zone Template! You can now load and display the same zones/levels on any/every chart you want! Share your friends and colleagues so that they might benefit from your analysis!
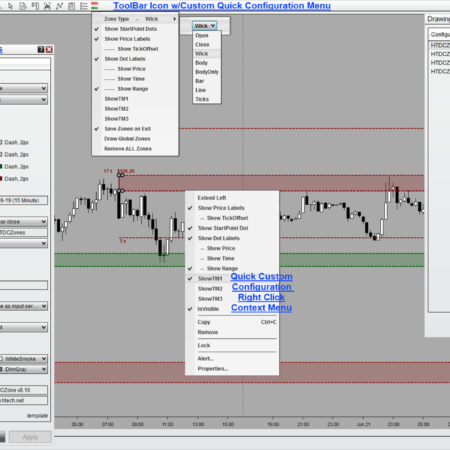
Select from 8 Unique Zone/Level/Region “Size” Types!
- Open
- Close
- Body
- Bar
- Wick
- Line
- Ticks
- Range
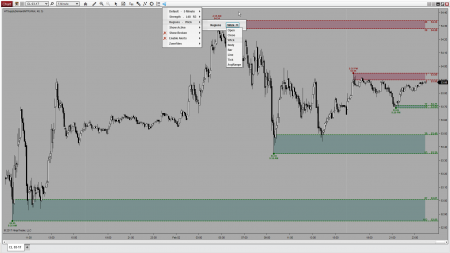
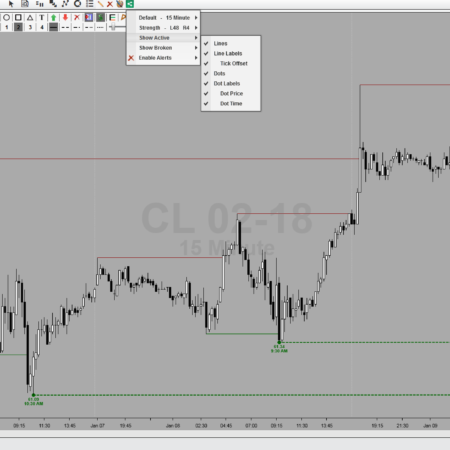
ToolBar DropDown Icon for Easy User Selectable Options and Adjustments Without Chart Refresh.
- Change/Set Zone/Level Data Series and Period Value (requires refresh)
- Change/Set Individual Look Back and Forward Strengths (requires refresh)
- Change/Set Zone/Level Size Type (requires refresh)
- Hide/Show All Zones/Levels with a Single Click
- Hide/Show Both Active and/or Broken Zones/Levels
- Hide/Show Price Labels for Zones/Levels/Dots
- Hide/Show Tick Offset Labels from Current Price
- Turn On/Off Adjustable Zone/Level Alert on Break
- Turn On/Off Adjustable Zone/Level Alert on Create
- Save, Manage, Load Zone Templates (loading requires refresh)
Please Click on Video Tab to Watch a Recorded Product Demonstration
Minimum Requirements – NinjaTrader 8.0.9.0

