
-

AI Bridge | NT8
Included in All AccessLet the AI assistant you already use work inside NinjaTrader 8. Ask in plain words and it opens charts, sets indicators, draws levels, manages your orders, writes scripts and runs backtests.
Key benefits:
– Works with Claude Code, Codex, Gemini CLI, Cursor and more.
– One add-on: no MCP server, no API keys, no coding.
– Manages the orders you place; placing orders is coming next.
– Your data stays on your PC; nothing is sent to High Tech. -
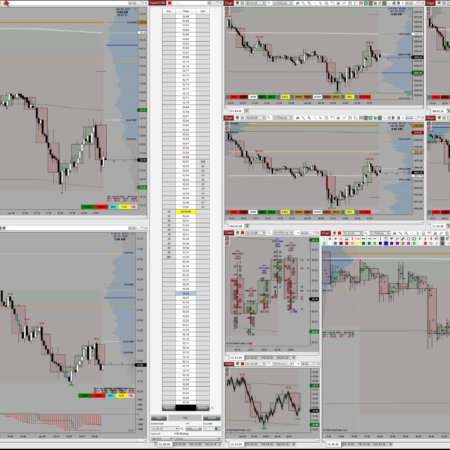
All Access | NT8
Original price was: $699.00.$499.00Current price is: $499.00. Save 28.61%Unlock the complete HTech NinjaTrader 8 tools suite under one membership. All Access includes every current HTech NT8 tool, plus drawing tools, bar types, chart styles, updates, and support while your membership is active.
Key benefits:
– Every current HTech NinjaTrader 8 tool, indicator, add-on, and utility.
– Covers workflow, chart markup, key levels, structure, risk, volume, and sound.
– 25+ tools, 39 drawing tools, bar types, and chart styles.
– Updates and support included while active.
– One year, non-renewing: no auto-rebill and no recurring billing agreement.Any two or three individual tools cost more than a full year of everything.
-
Auto Login | NT8
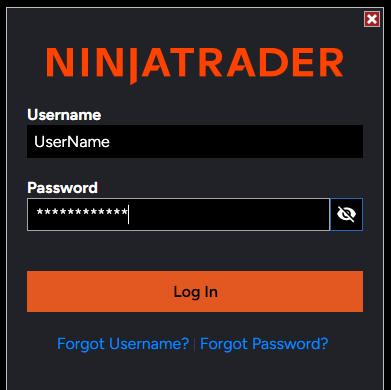
Free with any purchase. FreeNinjaTrader never remembers your password. Auto Login does: it launches NinjaTrader 8 and enters your saved password into the official login window automatically, so startup takes one double-click instead of another manual login.
Key benefits:
– Enters and submits your login in NinjaTrader’s official window.
– Encrypts your password with Windows security, never in plain text.
– Sends nothing over the internet and leaves nothing running.
– Hold Ctrl to stop the auto-login and change your password anytime.
– Included with All Access or any HTech purchase.A fast, local way into NinjaTrader 8, with nothing left running in the background.
-
Auto Tab | NT8 | Subscription
$49.99 / monthAuto Tab Automatically adds a “Tab Link Selector” to Every Chart Window (similar to the default Instrument and Interval Links). Change or Select the Tab of Any One Window, and All Other Windows (set to same Linked Color) will Change to that Same Tab.
This can now greatly reduce the real estate required for organizing and viewing your charts. Possibly, eliminate the need for multiple workspaces all together. AutoTab is extremely easy to use, will save you a ton of time, and will provide you the ultimate in convenience.
Built in Configurable Timer to Enable Auto Timed Tab Sequencing!
Features: (Click Image for a Detailed Description and Full List of Features)
– Automatically Adds a Tab Link Color Selector to Every NinjaTrader 8 Chart Window
– Automatically Switch Any/All Chart Window Tab(s) to that of Another with a Single Click
– Extremely Convenient and Easy User Selectable Configurations, Options, and Adjustments.
– 11 Unique Tab Color Options for Configuring Exactly what (if any) Chart Windows are Linked
– 1 Unique Tab Color Option to Link Any Chart Window’s Tabs to Any/All Chart Windows
– 1 Unique Tab Color Option to leave Linking Off for Any/All Chart WindowsA MUST for any Trader Concerned or Limited in Monitor Real Estate!
-
Auto Tab Linking | NT8
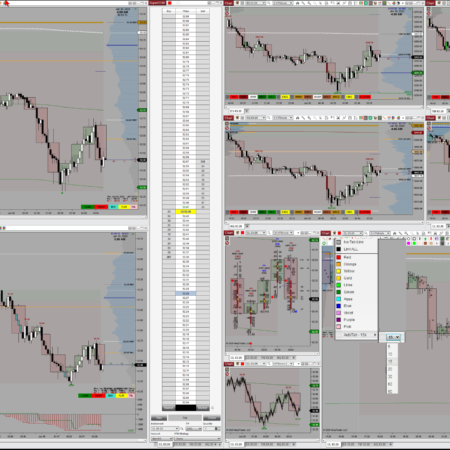
Original price was: $199.99.$149.99Current price is: $149.99. Save 25%AutoTab links NinjaTrader 8 tabs by color across charts, SuperDOMs, and most order-entry windows, so a whole group of windows follows one tab change instead of constant manual switching.
Key benefits:
– Change a tab on one color-linked window and every matching window follows.
– Keep tab-link color and Chart Trader Sync color independent.
– Middle-click the toolbar icon to auto-cycle tabs on a timer.
– Push account, quantity, and ATM strategy to the charts sharing a sync color.
– Reduce workspace switching and monitor clutter across multiple instruments. -
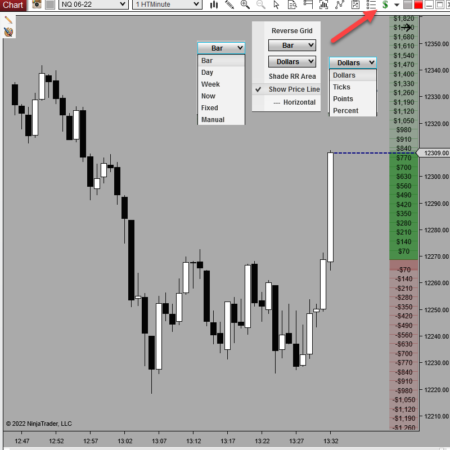
Chart Risk Reward | NT8
Original price was: $199.99.$149.99Current price is: $149.99. Save 25%See NinjaTrader 8 risk and reward directly beside price with a live right-side grid. Chart Risk Reward shows distance above and below the current reference in points, dollars, ticks, or percent, all changed from a dollar-sign toolbar icon.
Key benefits:
– Keeps a risk/reward grid visible as price moves.
– Grid types: Bar, Day, Week, Now, Fixed, and Dynamic, plus order and position overrides.
– Reads in points, dollars, ticks, or percent, with a one-click R-multiple override.
– Dollar-sign toolbar icon and context menu for quick on-chart changes.
– Optional order markers, position markers, and Chart Trader or position quantity sizing.A faster way to keep chart risk visible without manually drawing and recalculating measurements.
-
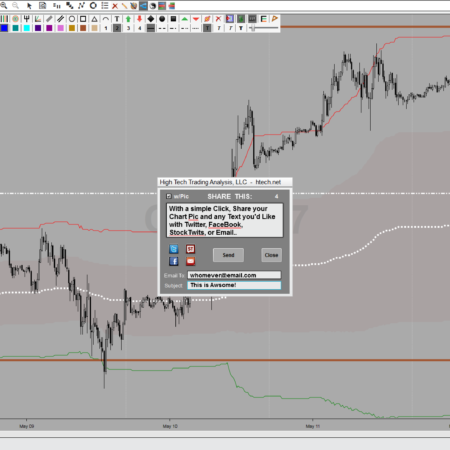
Chart Share | NT8
Free with any purchase. FreeCapture and save complete NinjaTrader 8 chart-window screenshots with one click. Chart Share adds a camera-style capture icon directly to chart windows and chart tabs so you can save the full chart window without switching tools or using a separate screenshot workflow.
Key benefits:
– Captures the chart panel, toolbar, tab area, instrument, timeframe, and entire chart.
– Saves chart images automatically to your DocumentsNinjaTrader 8 ChartShare folder.
– Names saved images with useful chart details so they are easier to identify later.
– Helps with trade review, support questions, chart notes, and sharing complete chart context.
– Share by email or post to StockTwits through your NinjaTrader Share Services accounts.A cleaner way to capture, organize, and share complete NinjaTrader chart screenshots.
-
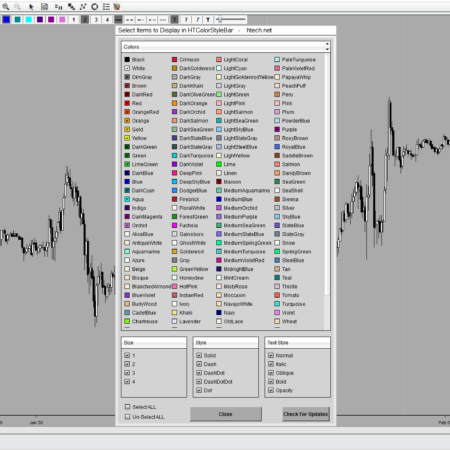
Color Style ToolBar | NT8
Original price was: $199.99.$149.99Current price is: $149.99. Save 25%The NinjaTrader 8 Color Style ToolBar puts color, line style, width, text style, and opacity controls right on your chart, so you style manually drawn objects with a click instead of reopening the drawing properties window.
Key benefits:
– Draw new objects in a chosen color and style from the DrawBar, the dropdown, or your function keys.
– Restyle drawings already on the chart with a select-then-click that guards against accidental changes.
– Adjust fill opacity so zones and regions stay readable over price.
– Pick which colors, sizes, styles, and controls appear, and collapse the bar for a clean chart.
– Included with DrawBar Ultimate for the full custom drawing workflow.Designed for traders who actively mark up charts.
-
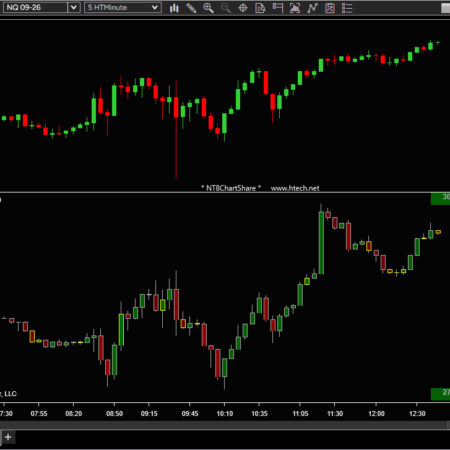
Cumulative Delta Plus | NT8
Original price was: $199.99.$149.99Current price is: $149.99. Save 25%Cumulative Delta Plus tracks the net difference between buying and selling volume in NinjaTrader 8, and lets you draw it three ways with flexible session resets.
Key benefits:
– Show delta per bar, around a zero line, or as cumulative candlesticks.
– Reset the cumulative view Daily, Weekly, or by Chart range.
– Add a visible-range sum and a right-axis marker for quick context.Built for traders who want delta context next to price.
-
Double Click Zones | NT8
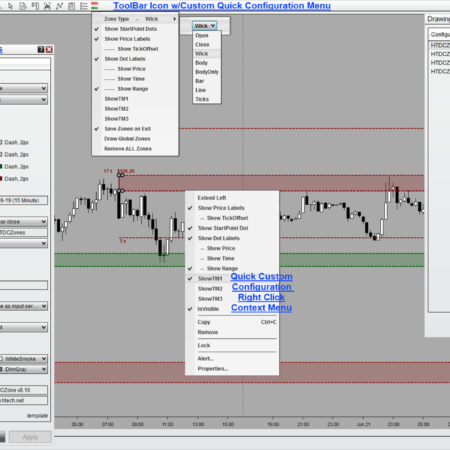
Original price was: $299.99.$199.99Current price is: $199.99. Save 33.33%Double Click Zones is a NinjaTrader 8 zone drawing tool. Double-click a bar and the configured zone draws itself, double-click again and it is gone, then manage everything from the chart toolbar.
Key benefits:
– Double-click a bar to place or remove a zone, line, or region
– Choose wick, body, bar, line, ticks, or FVG behavior
– Make zones global across every chart of the same instrument
– Set labels, alerts, targets, saving, and cleanup from one toolbarIncluded in All Access: one membership gives you this tool plus the full HTech NinjaTrader 8 suite.
-
Double Click Zones | NT8 | Subscription
$49.99 / monthManually Creating Levels of Interest Couldn’t Get Easier!
“Double Click Anywhere on Chart to Automatically Display!”
Select from 8 Unique Zone/Level/Region Size Types!
•Open •Close •Body •Bar •Wick •Line •Specified Ticks •Avg Range* Works with “ANY” default Bar, Data Series, Chart Type! *
Multiple Unique and/or User Configurable Features:
• Custom Right Click Context Menu Single Click Modifications
• Insert New Zones/Levels Any Where on your Chart!
• Remove/Delete “Any” Existing Zone/Level/Region!
• Modify, Move, and/or Remove Any Zone/Level on the Chart.
• Automatically Save your Zones on Exit! (Optional Yes/No)* Ability to Set “ANY” Zone/Level/Region as Global! *
* Independent and Unique Color Options for:
– Normal/Global and Upper/Lower Zones
* Independent and Unique Template Options for:
– Normal/Global and Upper/Lower Zones* Global/Normal Zones Settings are Completely Independent(Click Image for Detailed Description and Features!)
ToolBar DropDown Icon for Simple & Easy Configurations!
-
DrawBar – Ultimate
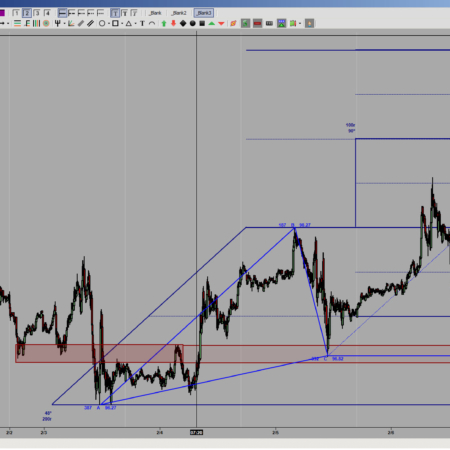
Original price was: $249.99.$199.99Current price is: $199.99. Save 20%– Add a Drawing ToolBar to any NinjaTrader Chart.
– Individually select the draw objects you'd like to display in Toolbar
– DropDown Icons for Easy User Selectable Options and Adjustments.
– Includes a Single Click Customizable Color/Style/Text Palette
– Selectable Mounting to the Top, Bottom, Left, or Right Hand Side
– Selectable Price Labels and Tick Offset Available for Most Draw Objects
– Selectable Auto Extend Rectangles to Far Right of Charts!
– Selectable Auto AB-CD Projections with Triangle and Pitchfork
– Selectable 50/100% Extensions Available on Most Draw Objects
– Selectable Fibonacci Zones Available on Triangle and Line (Coming Soon)
– Draw, Show, and/or Hide any Manually Drawn Object
– Show/Hide Ninja Trader Default Toolbar
– Show/Hide Trades Button
– Price Line Button
– Chart Pan Button– Customize and Label Any Draw Object with a Single Click!
– Added a build in WorkSpace Changer to Color/Style Palette!A MUST for any Serious Trader that Draws on Their Charts!
Absolutely Perfect for the Geometric Pattern or Fib Trader!
This is truly the Ultimate Drawing ToolBar for NinjaTrader 7!
-
DrawBar Ultimate | NT8
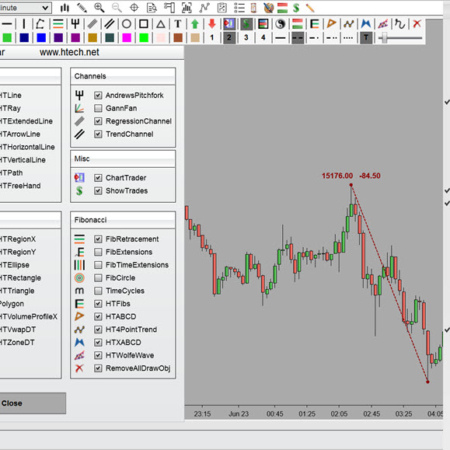
Original price was: $399.99.$299.99Current price is: $299.99. Save 25%DrawBar Ultimate is a NinjaTrader 8 drawing toolbar suite for active chart markup. It combines 36+ custom drawing objects, a right-click menu on every object, labels, templates, cleanup controls, and the bundled Color Style Bar.
Key benefits:
– Draw, label, extend, template, and restyle advanced chart objects from the chart
– Use 36+ custom tools for levels, patterns, zones, VWAP, profile, gaps, and risk and reward
– Adjust labels, extensions, alerts, and templates from a menu on every object
– Two products in one: the DrawBar suite plus the full Color Style BarFar more than NinjaTrader’s built-in drawing tools.
Included in All Access: one membership gives you this tool plus the full HTech NinjaTrader 8 suite.
-
DrawBar Ultimate | NT8 | Subscription
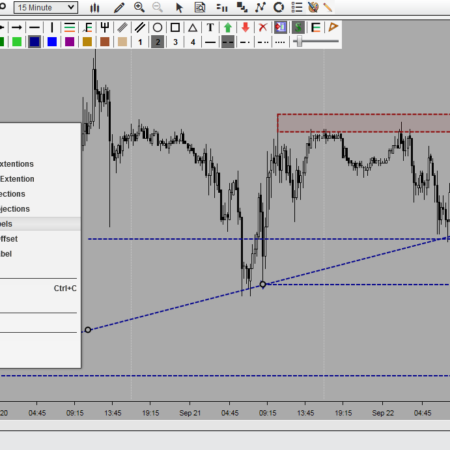
$49.99 / monthDrawBar Ultimate – Customizable Drawing, Color and Stylizing ToolBars. 12 Custom Drawing Tools w/Unique Properties/Rendering and Enhanced Right Click Context Menus. Draw, Show, Hide, Color, Style, Modify Any Manually Drawn Object w/Couple Clicks. Extremely Configurable! Extensive Options!
Specifically designed for the ease and convenience of drawing on your charts. Draw, Show, Hide, and Modify Color and Styles of Any manually drawn object with a single click. Perfect for both the novice and/or expert trader. Extremely easy to use, saves time, and provides the ultimate in convenience and technical analysis! There is currently no other tool like it for NinjaTrader 8 in the market place today!
12 Custom Drawing Tools | Unique Right Click Context Menus | Quick and Easy Property Changes!
Also Includes: NinjaTrader8 Color/Style Bar
Features: (Click Image for a Detailed Description and Full List of Features)
– Add a Customizable Drawing ToolBar to Any/All NinjaTrader 8 Charts.
– Draw, Show, and/or Hide any Manually Drawn Object with a Single Click
– Single Click Pop-Up Window for Easy User Selectable Options and Adjustments.
– Individually Select the Draw Object Icons You’d Like to Display in Toolbar
– Selectable Mounting to the Top or Left Hand Side of your Chart (coming soon)
– Show/Hide the Entire Drawing ToolBar with a Single Middle Click
– Show/Hide Chart Trader Button
– Show/Hide Trade Executions ButtonA Must for Any Serious Trader that Draws on their Charts!
-
Fixed Auto Center | NT8
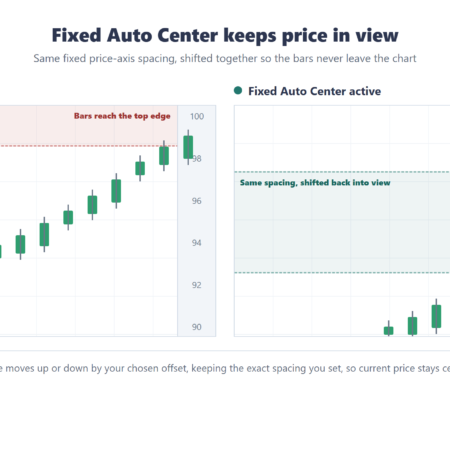
Included in All AccessFixed Auto Center keeps a NinjaTrader 8 fixed-scale chart centered on price without changing the price-axis spacing you set by hand. When price approaches the top or bottom of the visible range, it shifts the whole fixed scale so the bars stay in view.
Key benefits:
– Keeps fixed-scale charts from losing price off-screen.
– Preserves the same right-side price-axis spacing.
– Shifts the visible range up or down automatically.
– Draws no plots, markers, or chart objects.
– Hold Left Ctrl to pause recentering for manual scale adjustments. -
Magic Menu | NT8
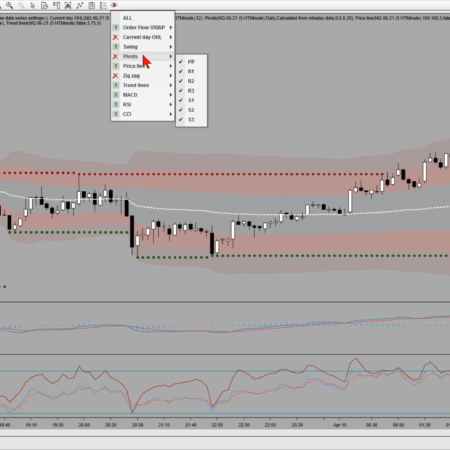
Original price was: $199.99.$149.99Current price is: $149.99. Save 25%Magic Menu is a NinjaTrader 8 indicator control menu that puts the plots, draw objects, and visibility of every indicator already on your chart behind one toolbar icon.
Key benefits:
– Automatically finds the indicators already loaded on your chart
– Hide or restore supported plots and draw objects without reopening each indicator
– Turn a whole indicator off, including a leftover lower panel, when you need toOne click hides the noise, one click brings it back.
-
Magic Menu | NT8 | Subscription
$49.99 / monthIdentifies All Indicators (Default or Custom) Applied to Any Chart!
Hide/Show Any/All of Your Applied Indicator’s:
* Plots
* DrawObjects
* VisibilityControl Most Aspects of All Applied Indicators thru Simple ToolBar DropDown Icon!
Please Click Product Image for Detailed List of Features and Limitations:
-
Market Pulse | NT8
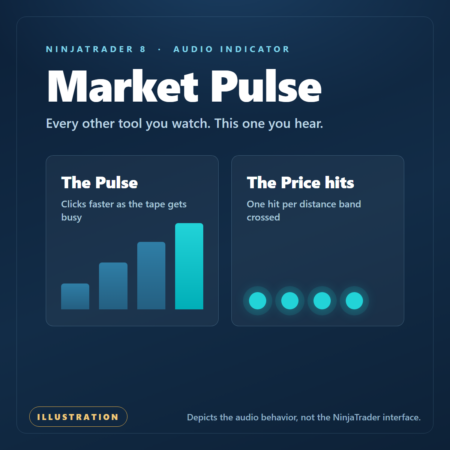
Included in All AccessMarket Pulse is a NinjaTrader 8 audio indicator that turns the live tape into sound, so market activity stays on your radar even when your eyes are somewhere else.
Key benefits:
– A Pulse that clicks faster as more trades hit the tape.
– Price hits that fire as price travels through the distance bands you set.
– Independent volumes, thresholds, and an idle auto-mute per voice. -
Multi Bars Plus | NT8
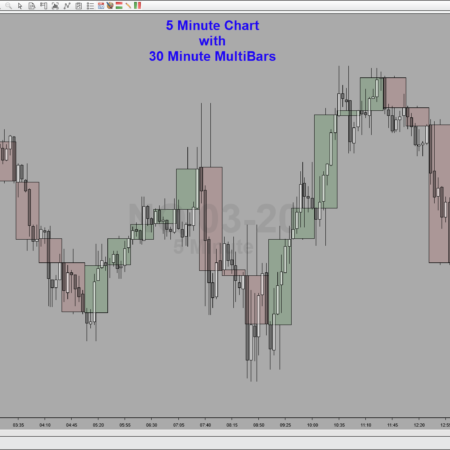
Original price was: $199.99.$149.99Current price is: $149.99. Save 25%Display multi-timeframe candles and grouped bar overlays on your active NinjaTrader 8 chart. Multi Bars Plus can show minute-based or bar-count overlays without forcing you to manage several separate charts or awkward multi-data-series layouts.
Key benefits:
– Show larger bar context directly on supported NinjaTrader 8 charts.
– Use Minute Mode for true minute-based overlays or Bar Mode for grouped primary bars.
– Review historical action with overlays that develop as the chart progresses.
– Control type, period, visibility, primary bars, area, outline, and wick from the toolbar.
– Display a configurable minute series as OHLC candles to the right of the primary chart.
– Adds current v8.26 guide lines and right-side candle display. -
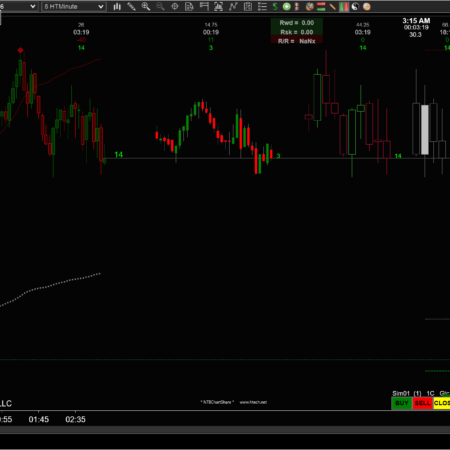
Multi Candles | NT8
Original price was: $199.99.$149.99Current price is: $149.99. Save 25%Keep a second timeframe in view beside your active NinjaTrader 8 chart with configurable minute candles, optional ATR, a timer, and live delta readouts.
Key benefits:
– Keep the minute-candle view you choose beside the chart you are already trading.
– Use multiple instances for several minute views on one chart.
– Show ATR, time remaining, completed delta, developing delta, and price-side delta.
– Pin candles to the far right or let them follow the visible chart bars.
– Tune candle width and spacing directly with mouse-wheel shortcuts.
– Mix several minute views on one primary chart. -
MultiBars Plus | NT8 | Subscription
$49.99 / monthDynamically Track, Overlay, and Display Multiple Dataseries on the Same Chart..
Add, Overlay, and Display any Minute Based Bars onto almost any other chart you want.. It’s Simple!.. Just add MultiBars to your chart.. Choose the number of minutes you’d like for your Overlay Bars.. and Wallah.. MultiBars Automatically Displays this for you, and Always in both a Logical and very aesthetically pleasing way!
Select from 2 Unique Modes of Operation! Minute Mode: | Bar Mode:
Just Choose how many minutes/bars you’d like overlay’d bars to be:
and MultiBars will Add, Overlay, and Always Display them Logically!
(Minute Mode Require Intraday Primary Chart Data!)** Dynamically Displays In Bar Progress while doing Historical Analysis! **
* Independent Color and Transparency Settings for Unlimited Choices!
* Remove the Clutter and Cumbersomeness of using of Multiple Charts!*** Works with “Most” default Bar, Data Series, or Chart Type! ***
-
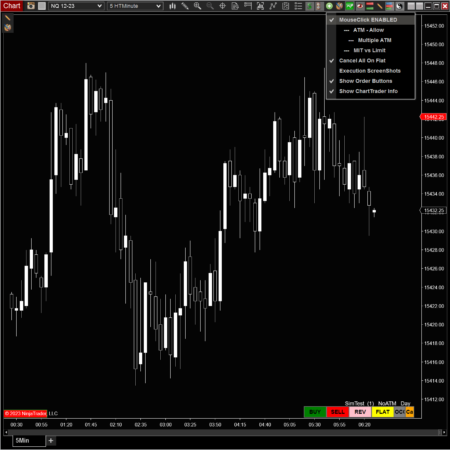
One Click Trader | NT8
Original price was: $199.99.$149.99Current price is: $149.99. Save 25%Trade from your NinjaTrader 8 chart with one click. One Click Trader keeps native BUY, SELL, and CLOSE actions at the chart edge, uses the Chart Trader context you selected, and can continue working an active ATM when configured. Test every workflow in Sim101 or Playback first.
Key benefits:
– Keep native BUY, SELL, and CLOSE actions beside the chart
– Place market, limit, and stop-market actions at the chart price
– Continue working an active Chart Trader ATM when the required controls are enabledKeep the market, your plan, and the next action in one view.
-
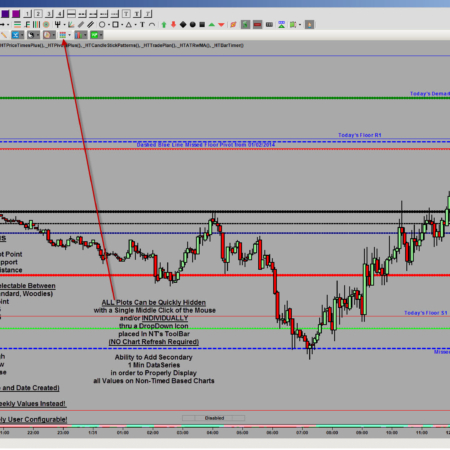
Pivots Plus
Original price was: $149.99.$99.99Current price is: $99.99. Save 33.34%Please Click on Image to View Products Description!
A Complete Product Description will be Added Here Very Soon!
-
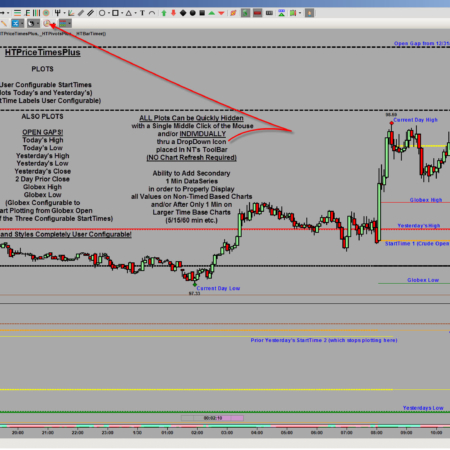
Price Times Plus
Original price was: $199.99.$149.99Current price is: $149.99. Save 25%Please Click on Image to View Products Description!
A Complete Product Description will be Added Here Very Soon!
-
Price Times Plus | NT8
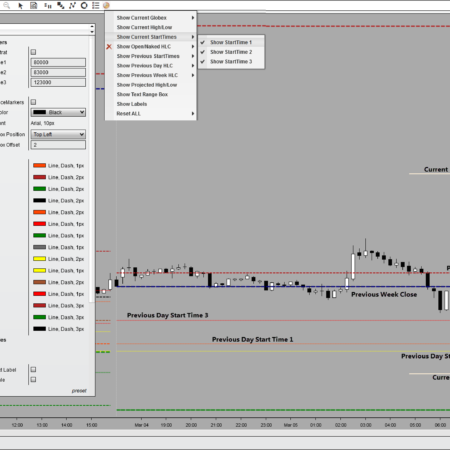
Original price was: $199.99.$149.99Current price is: $149.99. Save 25%Thirty-five daily, weekly, monthly, contract, rolling, and custom-time price levels, drawn on your NinjaTrader 8 charts by a single indicator.
Key benefits:
– Show or hide any level, any group, or all 35 from one toolbar icon, live, with no chart reload.
– Add three start times of your own, down to the minute, plus opening ranges and open/naked levels.
– Read every bar, daily, and weekly range in ticks, dollars, and percent from the on-chart summary box.Every level you keep coming back to, in one indicator, and only the ones you want on screen.
-
Price Times Plus | NT8 | Subscription
$49.99 / monthDisplays 24 Current/Previous/Projected OHLCR Levels of Significance..
Levels of Significance that Every Trader Should Be Aware Of!
Display them ALL from one Nicely put together package..(7) Current Daily Values:
(7) Previous Daily Values:
(3) Previous Weeks Values:
(2) Projected Daily Values:
(5) Range TextBox Displays:Pick ANY 3 Unique Times Down to the Minute
•Missed/Naked Previous Highs/Lows (coming soon)
– ALL Plots Can be Quickly Hidden (ALL or INDIVIDUALLY)
– ALL Plot Colors and Styles are Completely Configurable!
– ToolBar DropDown Icon for Simple and Easy User Selectable Options and Adjustments Without Chart Refresh.(Click Image for Detailed Description and Features!)
Quit Using Indicators that display different values on every chart your looking at!
-
Snap Grid | NT8
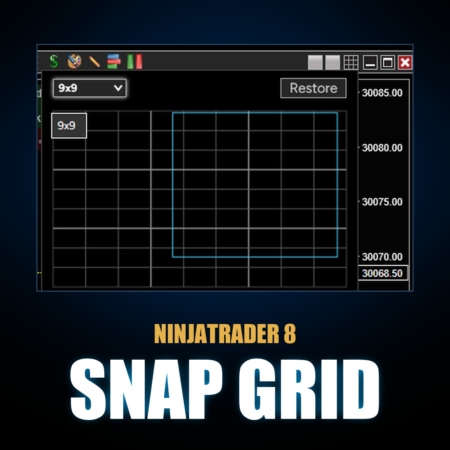
Included in All AccessSnap supported NinjaTrader windows into a clean grid layout from a button beside Minimize. Choose a zone, preview the destination, and release to arrange the workspace without manual resizing.
Key benefits:
– Snap a window to one grid cell or a larger selected area.
– Choose from 6×6 through 24×24 picker sizes, starting at 9×9.
– Preview the target on the desktop before the window moves.
– Restore the active window’s position before its last Snap Grid move. -
Supply & Demand
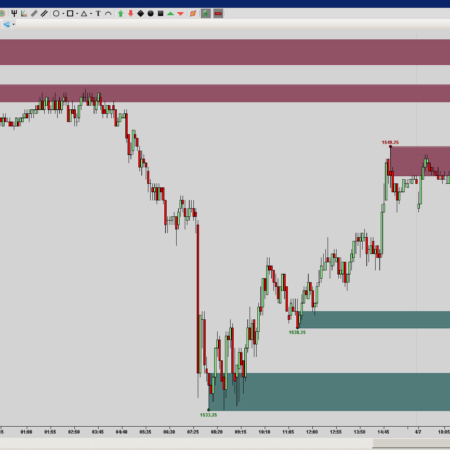
Original price was: $249.99.$199.99Current price is: $199.99. Save 20%– Calculates and Draws Supply and Demand Levels
– Calculates and Draws Swing High/Low's
– Individually Adjustable Look Back/Forward Strengths
– Hide or Shor Indictor with a Single Click
– Hide or Show Both Active and/or Broken Levels/Swings
– Hide or Show Price Labels for Levels/Swings/Dots
– Hide or Show Tick Offset Labels from Current Price
– Move or Remove Any Level/Swing on the Chart
– Turn On/Off Adjustable Alerts
– Auto Draw Fibs with selectable Bars Back (Beta).ToolBar DropDown Icon for Easy User Selectable Options and Adjustments Without Chart Refresh.
-
Supply & Demand (MTF)
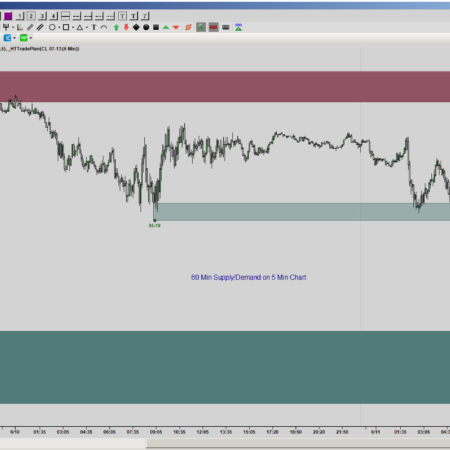
Original price was: $399.99.$299.99Current price is: $299.99. Save 25%Our “Multi-TimeFrame Supply and Demand” Includes “ALL” the Same Features as our standard “Supply and Demand” and “Swing” Indicators. It Also Includes the Ability, with User Configurable Properties, to Apply the Indicator using your Default chart data series, “OR” to Choose Any Other Data Series you'd Like!
– Watch 60 min supply and demand on a 5 min chart:
– Watch 5000 volume supply demand on a 500 volume chart:
– Watch 610 tick supply demand on a 144 tick chart:“OR” You Can Even Mix and Match Data Series:
– Watch 15 min supply demand on a 610 tick chart:
– Watch Volume on Tick, Tick on Volume, Min on Range, etc:
– Works across any Data Series: (with the exception of custom bar types)ToolBar DropDown Icon for Easy User Selectable Options and Adjustments Without Chart Refresh.
-
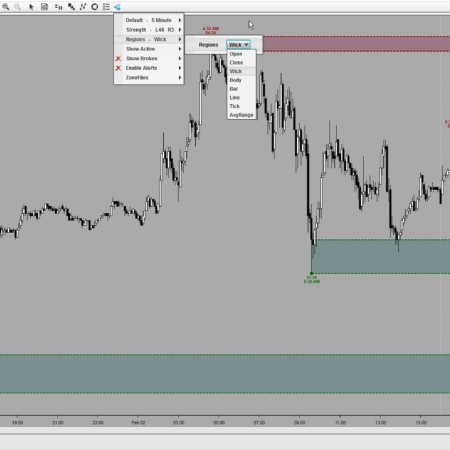
Supply & Demand (MTF) | NT8
Original price was: $399.99.$299.99Current price is: $299.99. Save 25%Automatically draw supply and demand zones on any NinjaTrader 8 chart from a left and right strength, display them across timeframes and data series, reshape them, then save the layouts you reuse.
Key benefits:
– Zones drawn for you from two independent strengths, no hand-drawing bar by bar.
– Bring higher-timeframe, volume, tick, range, Renko, daily, weekly, monthly, or yearly zones onto another chart.
– Save tuned layouts as zone files that survive a refresh, plus on-chart editing and optional alerts. -
Supply & Demand (MTF) | NT8 | Subscription
$49.99 / monthSupply and Demand (MTF) Automatically Displays Areas of Support and Resistance, while Assisting to Identify Market Rotation and Cycles, Trends, Swings, Turning Points, Break Outs, and Specific Areas of Interest. Merge, Modify, Move, Insert, Remove, Save, Load, Hide/Show Any Zone/Levels.
Display Supply and Demand Zones/Levels/Regions of any Data Series, on Any Chart!
•Minute •Second •Tick •Volume •Range •Renko •Daily •Weekly •Monthly •YearlySelect from 8 Unique Zone/Level/Region Size Types!
•Open •Close •Body •Bar •Wick •Line •Specified Ticks •Avg Range***** Now with the Ability to both Save and Load Your Own Customized Zone Templates *****
• Merge Any Zone/Level with the next/previous Zone/Level
• Modify, Move, and/or Remove Any Zone/Level on the Chart
• Insert New Zones/Levels Above or Below any Existing Zone/LevelFeatures: (Click Image for a Detailed Description and Full List of Features)
• Change/Set Zone/Level Data Series and Period Value (requires refresh)
• Change/Set Individual Look Back and Forward Strengths (requires refresh)
• Change/Set Zone/Level Size Type (requires refresh)
• Hide/Show All Zones/Levels with a Single Click
• Hide/Show Both Active and/or Broken Zones/Levels
• Hide/Show Price Labels for Zones/Levels/Dots
• Hide/Show Tick Offset Labels from Current Price
• Turn On/Off Adjustable Zone/Level Break Alert
• Turn On/Off Adjustable Zone/Level Create Alert
• Save, Manage, Load Zone Templates (loading requires refresh)ToolBar DropDown Icon for Easy User Selectable Options and Adjustments!
-
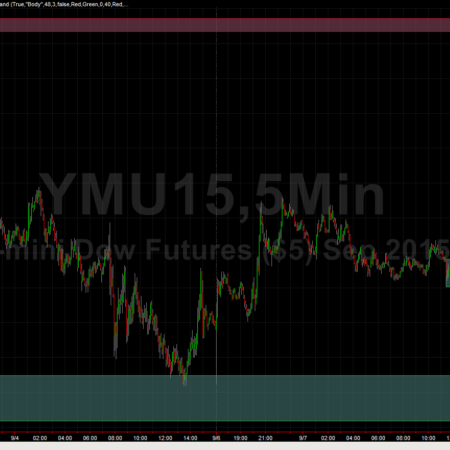
Supply & Demand | TradeStation | Subscription
$24.99 / monthSupply & Demand w/Optional Swings – TradeStation – Subscription
– Calculates and Draws Supply/Demand – Support/Resistance Levels
– Optionally Calculates and Draws Swing High and Low Levels
– Individually Adjustable Look Back and Forward Strengths
– User Configurable Zone Types (Open, Close, Wick, Body, Bar)
– User Configurable Colors and Transparency for Active Zones
– User Configurable Colors and Transparency for Broken Zones
– User Configurable Colors and Transparency for Price Labels
– Hide or Show Broken Supply/Demand – Support/Resistance – Swings
– Hide or Show Price Labels for Supply and Demand Levels/Swings
– Hide or Show Tick Offset Labels from Current Price (Coming Soon!)
– Optional Alerts for Zone Creation and/or Break (Coming Soon!)Please Click on Video Tab to Watch a Recorded Product Demonstration!
-
Supply & Demand w/Optional Swings | TradeStation
Original price was: $399.99.$249.99Current price is: $249.99. Save 37.50%Supply and Demand Zones – w/Optional Swings
– Calculates and Draws Supply/Demand – Support/Resistance Levels
– Optionally Calculates and Draws Swing High and Low Levels
– Individually Adjustable Look Back and Forward Strengths
– User Configurable Zone Types (Open, Close, Wick, Body, Bar)
– User Configurable Colors and Transparency for Active Zones
– User Configurable Colors and Transparency for Broken Zones
– User Configurable Colors and Transparency for Price Labels
– Hide or Show Broken Supply/Demand – Support/Resistance – Swings
– Hide or Show Price Labels for Supply and Demand Levels/Swings
– Hide or Show Tick Offset Labels from Current Price (Coming Soon!)
– Optional Alerts for Zone Creation and/or Break (Coming Soon!)Please Click on Video Tab to Watch a Recorded Product Demonstration!
-
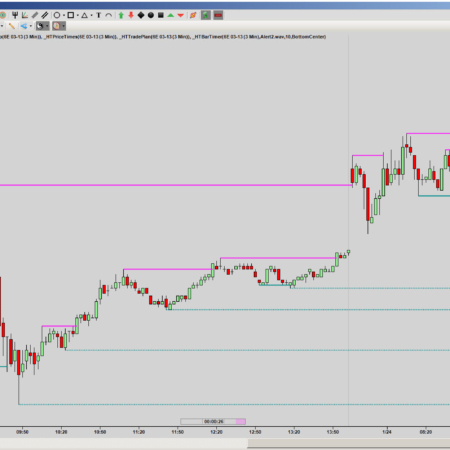
Swings
Original price was: $129.99.$99.99Current price is: $99.99. Save 23.08%– Calculates and Draws Swing High/Low's
– Individually Adjustable Look Back/Forward Strengths
– Hide or Show Indicator with a Single Click
– Hide or Show Active and/or Broken Swings
– Hide or Show Price Labels for Swings or Dots
– Hide or Show Tick Offset Labels from Current Price
– Move or Remove Any Swing on the Chart
– Turn On/Off Adjustable Alerts
– Auto Draw Fibs with selectable Bars Back (Beta).ToolBar DropDown Icon for Easy User Selectable Options and Adjustments Without Chart Refresh.
-
Swings – Lease to Own
$49.99 / month for 3 months– Calculates and Draws Swing High/Low's
– Individually Adjustable Look Back/Forward Strengths
– Hide or Show Indicator with a Single Click
– Hide or Show Active and/or Broken Swings
– Hide or Show Price Labels for Swings or Dots
– Hide or Show Tick Offset Labels from Current Price
– Move or Remove Any Swing on the Chart
– Turn On/Off Adjustable Alerts
– Auto Draw Fibs with selectable Bars Back (Beta).ToolBar DropDown Icon for Easy User Selectable Options and Adjustments Without Chart Refresh.
-
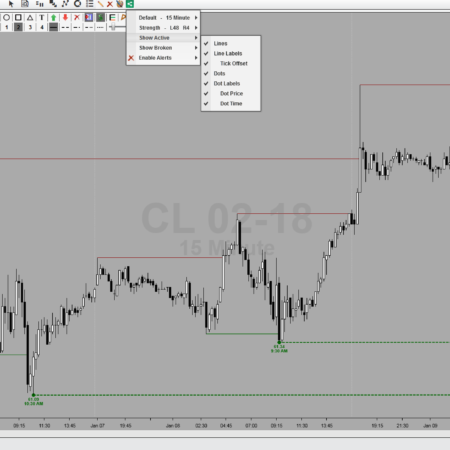
Swings – Multi-TimeFrame | NT8
Original price was: $199.99.$149.99Current price is: $149.99. Save 25%See higher-timeframe or mixed-data-series swing highs and lows on the NinjaTrader 8 chart you trade. Swings MTF draws the structure that frames the larger move and keeps it in front of you while you work.
Key benefits:
– Draw swings from any default data series on any chart
– Set left strength to qualify and right strength to confirm, independently
– Show or hide active swings, broken swings, labels, dots, and tick offsets
– Alerts when a swing forms or breaks, from one toolbar dropdown -
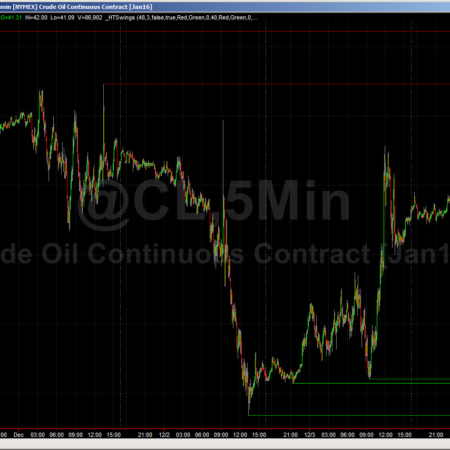
Swings – Support and Resistance (TS 9.5/10)
Original price was: $199.99.$149.99Current price is: $149.99. Save 25%Swings – Support and Resistance
– Calculates and Draws Swing High and Low Levels of Support and Resistance
– Individually Adjustable Look Back and Forward Strengths for Precise Settings
– User Configurable Colors and Transparency for Active Swing Highs/Lows
– User Configurable Colors and Transparency for Broken Swing Highs/Lows
– User Configurable Colors and Transparency for Swing High/Low Price Labels
– Hide or Show Broken Swing High/Low Levels of Previous Swing Levels
– Hide or Show Price Labels for Active Swing High and Low Levels
– Hide or Show Tick Offset Labels from Current Price (Coming Soon!)
– Optional Alerts for Swing Creation and/or Break (Coming Soon!)Please Click on Video Tab to Watch a Recorded Product Demonstration!
A trial and leasable version of this indicator is available on TradeStations AppStore:
https://tradestation.tradingappstore.com/products/Swings-SupportandResistanceAfter Purchase, this Indicator will be downloaded and accessed thru a Private Section of TradeStation’s AppStore,
Your TradeStation Customer Number and Network ID will be required Prior to Registration and Access! -
Swings (MTF) | NT8 | Subscription
$49.99 / monthSee Swings for Any Default Data Series you’d Like!
•Watch 60 min swings on a 5 min chart:
•Watch 5000 volume swings on a 500 volume chart:
•Watch 610 tick swings on a 144 tick chart:“OR” You Can Even Mix and Match Data Series:
•Watch 15 min swings on a 610 tick chart:
•Watch Volume on Tick, Tick on Volume, Min on Range, etc:
•Works across any default Data Series: (including most custom)– Calculates and Draws Swing High/Low’s
– Individually Adjustable Look Back/Forward Strengths
– Hide or Show Indicator with a Single Click
– Hide or Show Active and/or Broken Swings
– Hide or Show Price Labels for Swings or Dots
– Hide or Show Tick Offset Labels from Current Price
– Move or Remove Any Swing on the Chart
– Turn On/Off Adjustable AlertsToolBar DropDown Icon for Simple & Easy Configurations!
-
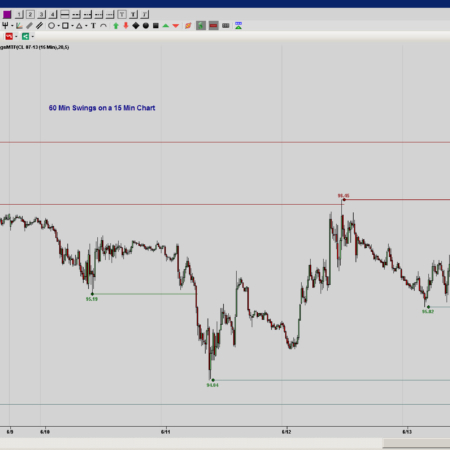
Swings Multi-TimeFrame
Original price was: $199.99.$149.99Current price is: $149.99. Save 25%Our “Multi-TimeFrame Swings” Includes “ALL” the Same Features as our standard “Swing” Indicator, but Also Includes the Ability, with User Configurable Properties, to Apply the Indicator using your Default chart data series, “OR” to Choose Any Other Data Series you'd Like!
– Watch 60 min swings on a 5 min chart:
– Watch 5000 volume swings on a 500 volume chart:
– Watch 610 tick swings on a 144 tick chart:“OR” You Can Even Mix and Match Data Series:
– Watch 15 min swings on a 610 tick chart:
– Watch Volume on Tick, Tick on Volume, Min on Range, etc:
– Works across any Data Series: (with the exception of custom bar types) -
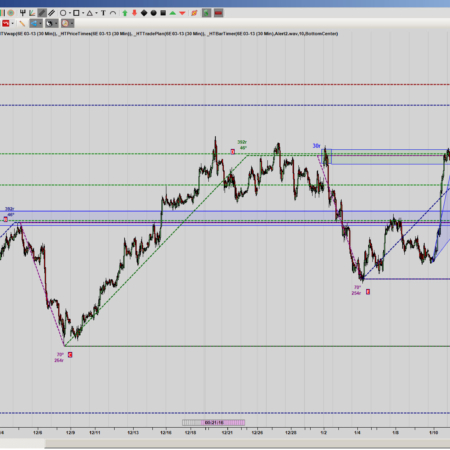
Trade Plan
Original price was: $149.99.$79.99Current price is: $79.99. Save 46.67%Trade Plan is a Unique Tool to Help you Plan and Analyze your Potential Trades..
– Individual Adjustable Contracts Size for up to 3 Targets
– Quantity Multiplier for Larger Size, Stock Traders, and/or Micro Forex
– Identifies Entry, Stops, and Targets
– Identifies Tick/Dollar Risk for Each Contract
– Identifies Tick/Dollar Reward for Each Contract
– Identifies Total Tick/Dollar Risk/Reward
– Identifies % of Account Size Risk/Reward
– Identifies Total Recommended Contract/Share Size
– Identified User Defined Trade Risk % of Account Size
– Identifies Total Trade Plan Summary
– Show/Hide Plan with Click of MouseToolBar DropDown Icon for Easy User Selectable Options and Adjustments.
Think – Plan – Trade
A Must Have For Any Serious Trader that Maps and Plans out Trades!
-
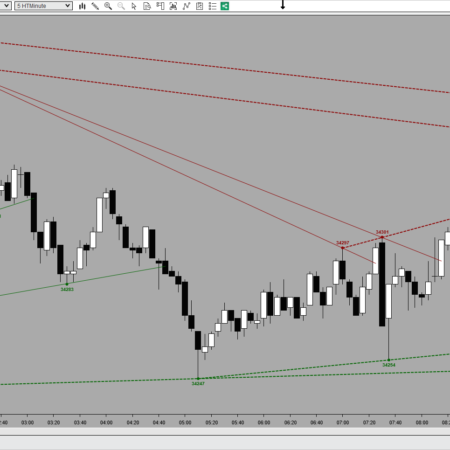
Trends (MTF) | NT8
Original price was: $299.99.$199.99Current price is: $199.99. Save 33.33%Display calculated swing and trend structure from one NinjaTrader 8 data series on another chart. Trends MTF keeps active and broken trend lines visible without manually rebuilding the same analysis.
Key benefits:
– Derive trend lines from configured swing structure
– Display active, broken, extended, and countertrend views
– Use primary or optional multi-timeframe default data series
– Expose latest swing and trend values to a strategy or other NinjaScript -
Trends (MTF) | NT8 | Subscription
$49.99 / monthSwing Trends Multi-TimeFrame | Support – Resistance | Technical Analysis
Takes Swing Multi-TimeFrame one step further by calculating and displaying Trends
See Swings and/or Trends for Any Default Data Series you’d Like!
- Watch 60 min swings/trends on a 5 min chart:
- Watch 5000 volume swings/trends on a 500 volume chart:
- Watch 610 tick swings/trends on a 144 tick chart:
“OR” You Can Even Mix and Match Data Series:
- Watch 15 min trends on a 610 tick chart:
- Watch Volume on Tick, Tick on Volume, Min on Range, etc:
- Works across any Data Series: (with the exception of custom bar types)
ToolBar DropDown Icon for Simple & Easy User Configurations!
– Calculates and Draws Swings and/or Trend High/Low’s
– Individually Adjustable Look Back/Forward Strengths
– Hide or Show Indicator with a Single Click
– Hide or Show Active and/or Broken Trends
– Hide or Show Price Labels for Trends or Dots
– Hide or Show Tick Offset Labels from Current Price
– Turn On/Off Adjustable Alerts -
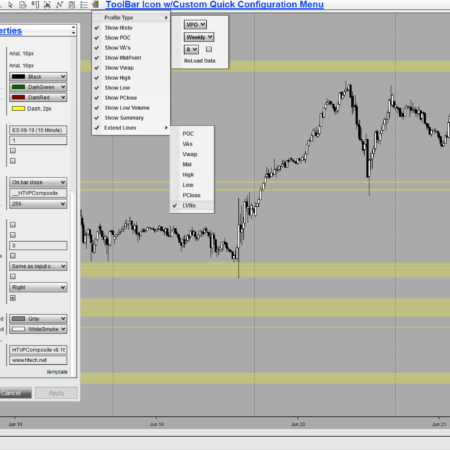
Volume Profile Composite | NT8
Original price was: $199.99.$149.99Current price is: $149.99. Save 25%Volume Profile Composite builds one NinjaTrader 8 volume profile over exactly the stretch of history you want to study. Today, this week, the last two months, a whole contract, the entire chart, or the span between two dates you pick.
Key benefits:
– Pick a period, add up to ten prior ones, and the window slides itself forward.
– Read POC, value area, VAH, VAL, VWAP, previous close, high, low, midpoint.
– Study a finished range on its own, with the developing period dropped out.
– Yellow lines mark exactly where the profile begins and ends.
– Shade the histogram Classic, Heat, or HeatMap, at the width you choose. -
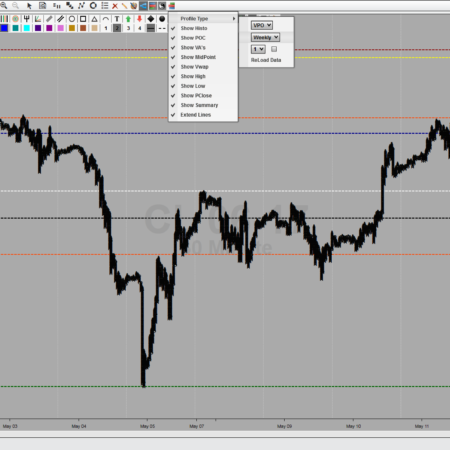
Volume Profile Composite | NT8 | Subscription
$49.99 / monthVolume Profile (VP) is an advanced charting technique that Displays Trading Activity (Volume), accumulated over Time (a specified period of time), at every tradable Price (between the time period’s High/Low). This technique plots a histogram on the chart meant to reveal dominant and/or significant price levels based on Volume at Price over Time. Both High and Low Volume Nodes (Price Levels) become easily visible to the trader.
2 Distinct Profile Types | 7 Configurable Composite Types | A Multitude of Enhanced Features!
Configuration Settings allow for a multitude of choices and ways to view Profiles of Unique Revolving Durations, or from a Specified Start Date, or even View a Profile Specified Between Any 2 Dates.
Levels of Significance: (Click Image for a Detailed Description and Full List of Features)
– Value Area (VA) – Specified percentage of all volume traded during Specified Time Period.
– Value Area High (VAH) – The Highest Price level within the Value Area.
– Value Area Low (VAL) – The Lowest Price level within the Value Area.
– Point of Control (POC) – The Price level for the time period with the Highest Traded Volume.
– Volume Weighted Avg Price (VWAP) – Volume Weighted Average Price of Specified Time Period.
– Previous Close (PC) – Last Closing Price Before Volume Profile Start DateTime.
– Profile High (HIGH) – The Highest reached Price level during the Specified Time Period.
– Profile Low (LOW) – The Lowest reached Price level during the Specified Time Period.
– Profile MidPoint (MID) – The Midpoint reached Price level during the Specified Time Period.
– Additional Summary Information of Profile!ToolBar DropDown Icon for Easy User Selectable Options and Adjustments!
-
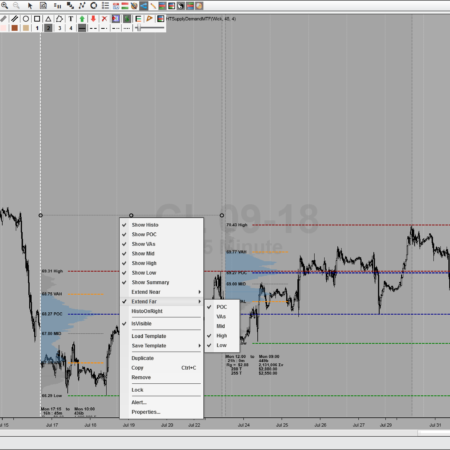
Volume Profile Dynamic | NT8
Original price was: $199.99.$149.99Current price is: $149.99. Save 25%Volume Profile Dynamic draws a volume profile around whatever part of your NinjaTrader 8 chart you point at. Click where it starts, click where it ends, and the profile builds inside. Not a session, not a date range, just the move you are looking at.
Key benefits:
– Click a start and an end, and the profile builds inside that region.
– Draw as many regions as you want, each with its own profile and levels.
– Read POC, value area, VAH, VAL, high, low, and midpoint for the move itself.
– Extend the levels you choose near the region or across the whole chart.
– Build it from ticks, minutes, or bars, depending on how exact you need it. -
Volume Profile Dynamic | NT8 | Subscription
$49.99 / monthVolume Profile is an advanced charting technique that displays trading activity (Volume), accumulated over a specified time period, at specified price levels. This technique plots a histogram on the chart meant to reveal dominant and/or significant price levels based on Volume at Price over a specified period of Time. Essentially, Volume Profile compares and calculates the total volume traded at a specific price level during the specified time period, to the total overall volume for that same period. Then represents and displays this information as a vertical histogram making it easily visible to the trader.
“Dynamically Draw Volume Profiles” | AnyWhere on Chart!
Levels of Significance: (Click Image for Detailed Features!)
– Value Area (VA) – Specified percentage of all volume
– Value Area High (VAH) – Highest Price level of Value Area
– Value Area Low (VAL) – Lowest Price level of Value Area
– Point of Control (POC) – Highest Traded Volume Price level
– Volume Weighted Avg Price (VWAP) – VWAP of Profile
– Previous Close (PC) – Last Closing Price Before Profile Start
– Profile High (HIGH) – Highest reached Price level of Profile
– Profile Low (LOW) – Lowest reached Price level of Profile
– Profile MidPoint (MID) – Midpoint Price level of Profile
– Additional Summary Information of Profile!ToolBar DropDown Icon for Simple & Easy Configurations!
-
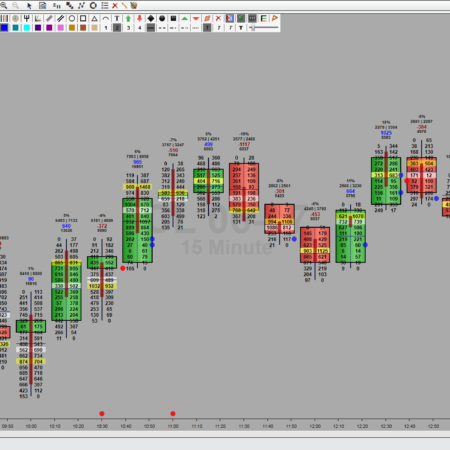
Volume Profile OrderFlow | NT8
Original price was: $399.99.$299.99Current price is: $299.99. Save 25%Volume Profile OrderFlow rebuilds the executed buying and selling behind every bar, at every price level it traded, from NinjaTrader 8 tick data. See volume, delta, and buy and sell imbalances at every price inside the bar.
Key benefits:
– Read buy volume, sell volume, and delta at every price in the bar.
– Keep per-bar POC, value area, VWAP, and midpoint in context.
– Mark diagonal, horizontal, or combined imbalances as levels that persist.
– Catch the bar whose delta disagrees with its direction.
– Toggle every surface from the chart toolbar, no trip through properties. -
Volume Profile OrderFlow | NT8 | Subscription
$49.99 / monthHTOrderFlow was designed with many enhanced features in order to help reveal a unique perspective of Significant Price Levels within Each Bar (POC, Value Area, Vwap, MidPoint), Price and Bar Volume, Delta, and even Buy/Sell Imbalances. This approach offers exceptionally detailed information, and greatly assists any trader to “See What is Really Going on inside each and every bar, at every price level!”
“What’s Really Going on Inside Every Bar at Every Price Level!”
Levels of Significance (Each Bar) (Click Image for Details)
• Buy and Sell Volume or Delta Volume – at Price
• Value Area (VA) – Specified Percentage of all volume traded
• Point of Control (POC) – Highest Traded Volume Price Level
• Volume Weighted Avg Price (VWAP) – Bar Vwap Price Level
• Profile MidPoint (MID) – Midpoint Price Level of Bar
• Buy and Sell Imbalances (Bar/Price) (Diagonal/Horizontal)Dual Programmable Buy vs. Sell Imbalance Visual Alerts
• Diagonal Buy/Sell Imbalance – Independent Ratio Multiples
• Horizontal Buy and Sell Imbalance – Independent Ratios
Display Either, Both, or even Combination of ImbalancesAdditional Summary Information Displayed Over Each Bar
• Total Volume of Bar
• Total Buys and Total Sells of Bar
• Total Delta Volume – Total Buy minus Total Sell Volume
• Total Delta Percentage – Delta Volume / Total VolumeToolBar DropDown Icon for Simple and Easy Configuration!
-
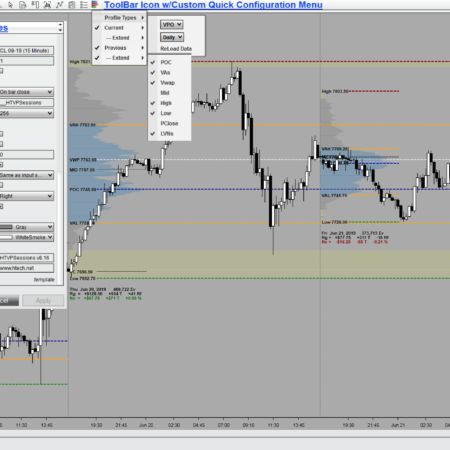
Volume Profile Sessions | NT8
Original price was: $199.99.$149.99Current price is: $149.99. Save 25%Volume Profile Sessions profiles every daily, weekly, monthly, yearly, or contract session on your NinjaTrader 8 chart, from the session open to the close. The current session develops as it trades while completed sessions keep their finished levels.
Key benefits:
– Profile any session type, from volume traded or time spent at each price.
– Read POC, value area, VAH, VAL, VWAP, previous close, high, low, midpoint.
– Park the developing profile at the far right, clear of completed sessions.
– Switch every level off, then bring back only the references you trade from.
– Shade the histogram Classic, Heat, or HeatMap, at the width you choose. -
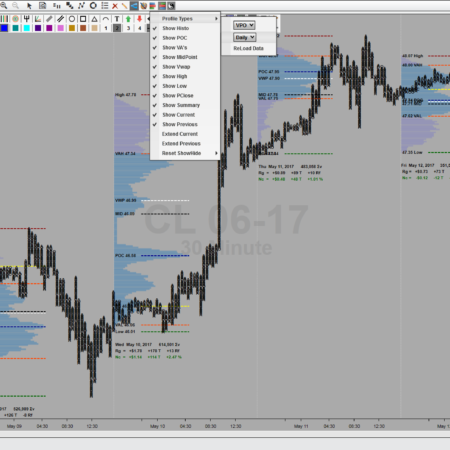
Volume Profile Sessions | NT8 | Subscription
$49.99 / monthVolume Profile (VP) is an advanced charting technique that Displays Trading Activity (Volume), accumulated over Time (a specified period of time), at every tradable Price (between the time period’s High/Low). This technique plots a histogram on the chart meant to reveal dominant and/or significant price levels based on Volume at Price over Time. Both High and Low Volume Nodes (Price Levels) become easily visible to the trader.
2 Distinct Profile Types | 5 Configurable Session Types | A Multitude of Enhanced Features!
Levels of Significance: (Click Image for a Detailed Description and Full List of Features)
– Value Area (VA) – Specified percentage of all volume traded during Specified Time Period.
– Value Area High (VAH) – The Highest Price level within the Value Area.
– Value Area Low (VAL) – The Lowest Price level within the Value Area.
– Point of Control (POC) – The Price level for the time period with the Highest Traded Volume.
– Volume Weighted Avg Price (VWAP) – Volume Weighted Average Price of Specified Time Period.
– Previous Close (PC) – Last Closing Price Before Volume Profile Start DateTime.
– Profile High (HIGH) – The Highest reached Price level during the Specified Time Period.
– Profile Low (LOW) – The Lowest reached Price level during the Specified Time Period.
– Profile MidPoint (MID) – The Midpoint reached Price level during the Specified Time Period.
– Additional Summary Information of Profile!ToolBar DropDown Icon for Easy User Selectable Options and Adjustments!
-
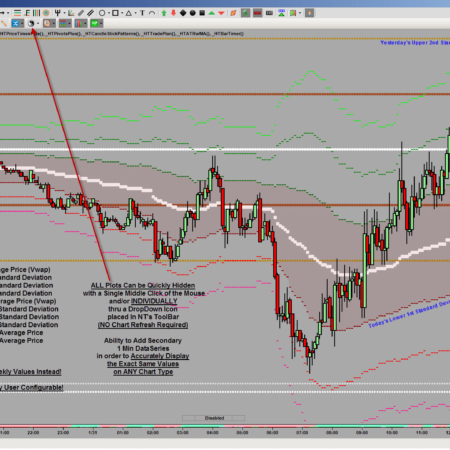
Vwap Plus
Original price was: $199.99.$149.99Current price is: $149.99. Save 25%– Today's Volume Weighted Average Price (VWAP)
– Today's 3 Unique Upper and Lower Standard Deviations of VWAP
– Yesterday's Volume Weighted Average Price (VWAP1)
– Yesterday's 1st 2 Upper and Lower Standard Deviations of VWAP1
– 2 Day Prior Volume Weighted Average Price (VWAP2)
– 3 Day Prior Volume Weighted Average Price (VWAP3)
– Missed/Naked Yesterday's VWAP1's
– ALL Plots Can be Quickly Hidden (INDIVIDUALLY and/or Altogether)
With a Single Mouse Click Thru a DropDown Icon Placed in NT’s ToolBar
– Accurately Display The Exact Same Values On ANY Chart Type!
– ALL Plot Colors and Styles are Completely User Configurable!
– Can Also Be Used to Plot ALL Above Weekly Values Instead!An Indicator I Wouldn't Want to Trade Without!
-
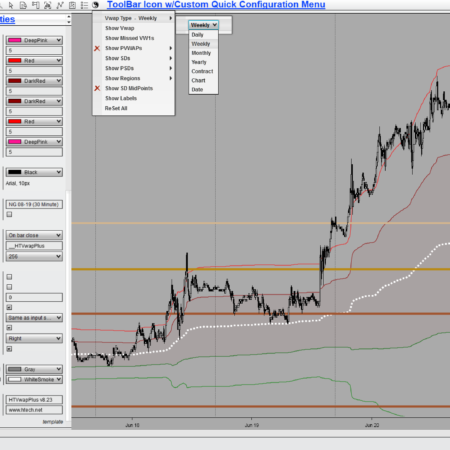
VWAP Plus | NT8
Original price was: $199.99.$149.99Current price is: $149.99. Save 25%VWAP Plus keeps NinjaTrader 8 VWAP, standard-deviation, and previous-session levels consistent on every chart you put it on, rounded to the tick. Choose from eight period types, read 22 current, previous-session, and midpoint plots, and show or hide any of them from a chart-toolbar menu.
Key benefits:
– See the same VWAP levels on every chart in your workspace.
– Read developing, previous-session, and standard-deviation levels in one indicator.
– Switch periods and hide levels from the toolbar, without reopening properties. -
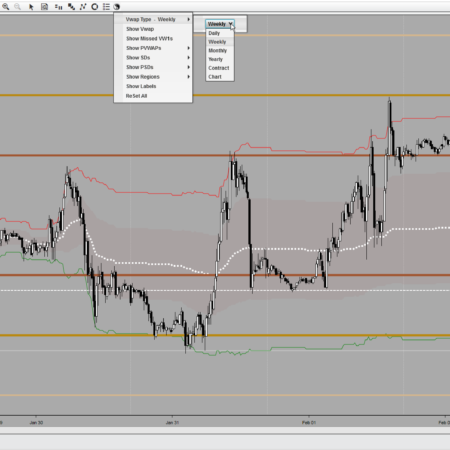
Vwap Plus | NT8 | Subscription
$49.99 / monthVolume-Weighted Average Price (VWAP) is the ratio of volume traded at price, to the total volume traded, over a particular time horizon. VWAP is often used as a trading benchmark by investors who aim to be as passive as possible in their execution. The aim of using a VWAP is to ensure that the trader executing the order does so in-line with volume on the market.
7 User Configurable VWAP Session Period Types:
• Daily • Weekly • Monthly • Yearly • Contract • Chart • User Defined Date17 Unique Current and Previous Session Value Plots
Current Session Developing Plots:
• Volume Weighted Average Price (VWAP)
• 3 Unique Upper and Lower Standard Deviations of VWAPPrevious Session Plots:
• 1 Session Prior Volume Weighted Average Price (VWAP1)
• 3 Unique Upper and Lower Standard Deviations of Previous VWAP1
• 2 Session Prior Volume Weighted Average Price (VWAP2)
• 3 Session Prior Volume Weighted Average Price (VWAP3)ToolBar DropDown Icon for Easy User Selectable Options and Adjustments!
VWAP Values/Plots Remain Consistent (Are the Exact Same) Across Every DataSeries!
Accurately Display and Trade Off of The Exact Same Values On All Your Charts!
Indicator
A subscription has been removed from your cart. Products and subscriptions can not be purchased at the same time.
Recent Reviews
-
Snap Grid | NT8
Rated 5 out of 5by roger
-
Price Times Plus | NT8
Rated 5 out of 5by Jimmy
-
DrawBar Ultimate | NT8
Rated 5 out of 5by Tammo Eckert
-
Supply & Demand (MTF) | NT8
Rated 5 out of 5by Anthony Wood
-
Color Style ToolBar | NT8
Rated 5 out of 5by Alex Koe
-
Auto Tab Linking | NT8
Rated 5 out of 5by Alex Koe
-
Auto Tab Linking | NT8
Rated 5 out of 5by Randy Campbell
Product Reviews
- i have a 4 monitor set up with different scaling and 2 of...August 18, 2026 by roger
- This is the best product for determining daily/weekly/monthly...March 13, 2026 by Jimmy
- Great drawing tool. Working with it makes my life easier...August 4, 2025 by Tammo Eckert
- I have been a customer for several years now and the support...June 26, 2025 by Anthony Wood
- I have tried almost all of the drawing tools out that in...June 1, 2025 by Alex Koe
- For someone that trades multiple commodities at once, the...June 1, 2025 by Alex Koe
- Auto Tab makes following multiple futures symbols in different...January 28, 2025 by Randy Campbell
Best Sellers
-
 Supply & Demand (MTF) | NT8
Rated 5.00 out of 5
Supply & Demand (MTF) | NT8
Rated 5.00 out of 5$399.99Original price was: $399.99.$299.99Current price is: $299.99. -
 Auto Tab Linking | NT8
Rated 5.00 out of 5
Auto Tab Linking | NT8
Rated 5.00 out of 5$199.99Original price was: $199.99.$149.99Current price is: $149.99. -
 Volume Profile Sessions | NT8
Rated 5.00 out of 5
Volume Profile Sessions | NT8
Rated 5.00 out of 5$199.99Original price was: $199.99.$149.99Current price is: $149.99. -
 DrawBar Ultimate | NT8
Rated 4.94 out of 5
DrawBar Ultimate | NT8
Rated 4.94 out of 5$399.99Original price was: $399.99.$299.99Current price is: $299.99. -
 VWAP Plus | NT8
Rated 5.00 out of 5
VWAP Plus | NT8
Rated 5.00 out of 5$199.99Original price was: $199.99.$149.99Current price is: $149.99. -
 Double Click Zones | NT8
Rated 5.00 out of 5
Double Click Zones | NT8
Rated 5.00 out of 5$299.99Original price was: $299.99.$199.99Current price is: $199.99. -
 Chart Risk Reward | NT8
Rated 5.00 out of 5
Chart Risk Reward | NT8
Rated 5.00 out of 5$199.99Original price was: $199.99.$149.99Current price is: $149.99.
| M | T | W | T | F | S | S |
|---|---|---|---|---|---|---|
| 1 | 2 | 3 | 4 | |||
| 5 | 6 | 7 | 8 | 9 | 10 | 11 |
| 12 | 13 | 14 | 15 | 16 | 17 | 18 |
| 19 | 20 | 21 | 22 | 23 | 24 | 25 |
| 26 | 27 | 28 | 29 | 30 | 31 | |